Thinkorswim vs TradingView: A Detailed Comparison for Traders
MarketDash Editorial Team
Author
Selecting the right trading platform determines whether traders catch profitable trends or watch opportunities slip away. Both Thinkorswim and TradingView provide robust charting tools, real-time data feeds, and technical indicators for AI Stock Technical Analysis. Each platform offers distinct advantages, from indicator libraries and drawing tools to pricing structures and mobile functionality. Understanding these differences helps traders choose the platform that aligns with their specific trading approach and objectives.
Beyond comparing charting software and backtesting features, traders benefit from intelligent insights that complement their chosen platform. Thinkorswim excels with advanced options chains, while TradingView shines through social community features. Having access to AI-powered tools helps validate technical setups, identify emerging patterns, and execute informed trades across stocks, futures, and forex markets with MarketDash's comprehensive market analysis.
Table of Contents
- What is Thinkorswim, and How Does It Work?
- What is TradingView, and How Does It Work?
- Do Thinkorswim and TradingView Have Any Similarities?
- Thinkorswim vs TradingView: Differences
- Which One Should You Choose?
- Try our Market Analysis App for Free Today | Trusted by 1,000+ Investors
Summary
- Thinkorswim is Charles Schwab's professional trading platform, with zero platform fees once you open a brokerage account, making institutional-grade tools accessible without monthly software costs. The all-inclusive model covers real-time U.S. market data, advanced options analytics, custom scripting, and paper trading, though you pay standard commissions on trades. TradingView offers tiered subscriptions, starting with a free plan with ads and feature limits, then scaling to paid plans that unlock more charts, alerts, and data history. Real-time feeds for certain exchanges cost extra, and serious traders often need premium tiers to access features like multiple layouts or extended backtesting, potentially adding $15 to $100 per month to trading expenses depending on requirements.
- Options traders building multi-leg income strategies around volatility depend on risk modeling tools that Thinkorswim delivers, but TradingView lacks. The Analyze tab projects profit and loss across price ranges, time-decay scenarios, and implied-volatility shifts before you commit capital, displaying real-time Greeks as underlying prices move. You can simulate iron condors, butterflies, or calendars with visual risk graphs, then stress-test positions against historical volatility to see how similar setups performed during past earnings or macro events. TradingView offers basic options chains with bid-ask spreads and volume, plus improved analytics for single-leg positions, yet it doesn't simulate complex spreads or display real-time Greeks across multiple expirations, leaving serious options traders without the probability calculators and strategy builders they use daily.
- Thinkorswim requires desktop installation and performs best on multi-monitor setups with dedicated system resources, delivering stability during high-volume sessions but demanding more from hardware. The interface feels dense, with customizable workspaces that let you arrange dozens of widgets, charts, and watchlists, then save layouts for instant recall. TradingView runs entirely in the browser with no installation, loading instantly on any computer, tablet, or phone with internet access. Cloud syncing keeps layouts, alerts, and scripts identical across devices, so you start analysis on a laptop, check positions on your phone during lunch, and resume on a different computer without reconfiguring anything, favoring mobility and instant access over raw multi-monitor power.
- TradingView spans over 100,000 instruments across global stock exchanges, forex pairs from major and exotic currencies, commodities, indices, bonds, and spot cryptocurrency markets, including altcoins that traditional brokerages ignore. You switch from analyzing S&P 500 futures to comparing emerging market equities to tracking on-chain Bitcoin metrics without changing platforms. Thinkorswim centers on U.S. equities, options, futures contracts traded on CME and similar exchanges, and major forex pairs, with limited international stock access and cryptocurrency available only through Bitcoin and Ethereum futures rather than spot trading, serving traders who concentrate on domestic markets and preferthe regulatory clarity of established U.S. exchanges.
- TradingView builds an entire social network around charting, where millions of users publish trade setups, educational posts, and market commentary tagged by asset and strategy. You follow contributors whose analysis aligns with your approach, upvote useful ideas, and see performance tracking that reveals which analysts called moves accurately over time. The open-source Pine Script library hosts over 100,000 community indicators and strategies you can apply instantly or modify, with competitions and leaderboards that gamify skill development. Thinkorswim keeps social features minimal, focusing on Schwab's educational library, webinars, and coaching sessions rather than user-generated content, with no public idea feed, no script marketplace, and no mechanism to follow specific analysts outside private chat rooms within the mobile app.
- Market analysis helps traders filter signal from noise by curating high-probability opportunities through expert review and AI pattern detection, so you validate fewer trades with higher conviction instead of managing endless watchlists and conflicting indicators across technical platforms.
What is Thinkorswim, and How Does It Work?
Thinkorswim is a complete electronic trading platform from Charles Schwab for active, self-directed traders. It began as an options-focused brokerage in the late 1990s and became part of Schwab following the 2020 acquisition of TD Ameritrade, with integration for Schwab clients by 2023.

🎯 Key Point: Thinkorswim serves as a comprehensive all-in-one solution for traders who want advanced charting, real-time data, and sophisticated analysis tools without switching between multiple platforms.
"Thinkorswim has evolved from a specialized options platform into one of the most robust trading ecosystems available to retail investors." — Trading Platform Analysis, 2023

💡 Example: A day trader can use thinkorswim to simultaneously scan for stocks, analyze technical patterns, execute trades, and monitor positions - all within the same integrated interface.

What features and capabilities does Thinkorswim offer?
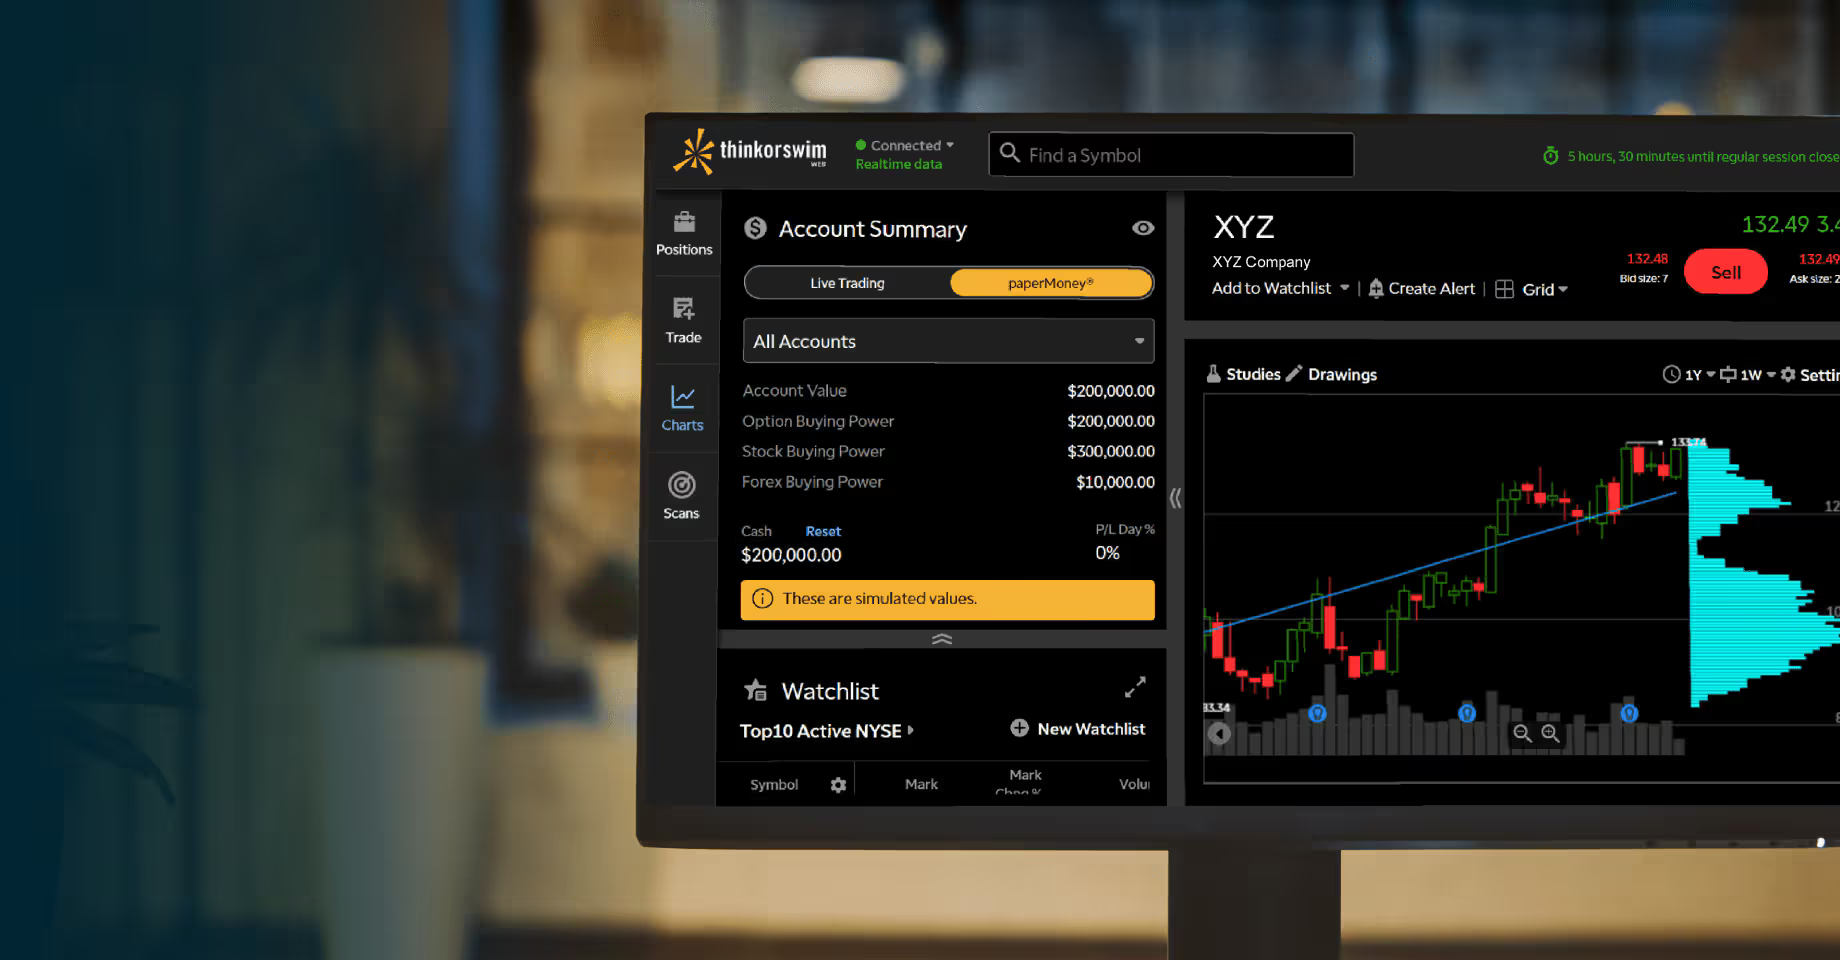
It provides real-time data and sophisticated analytics through desktop software, a web browser version, and a mobile app, making it ideal for quick checks on the go or detailed strategy testing at a workstation.
Thinkorswim supports stocks, ETFs, options, futures, and forex, with 24/5 trading availability on more than 1,100 stocks and ETFs (including major indices like the S&P 500 and Nasdaq-100) introduced in 2025.
How much does Thinkorswim cost, and how do you access it?
There are no platform fees for Schwab account holders. Users can obtain a free Guest Pass to trial the tools before opening an account. The suite emphasises customisation, simulation, and depth, enabling users to test complex ideas in live market conditions.
You can start by opening a standard Schwab brokerage account with no minimum deposit required. Users can download the desktop version for maximum power, log into the web platform at trade.thinkorswim.com for browser access, or install the mobile app. All versions sync watchlists, positions, and settings smoothly.
Key Features of Thinkorswim
Thinkorswim offers a complete set of trading tools and features for both new and professional traders. The platform combines advanced technical analysis tools with intuitive interfaces across multiple devices, making it popular among serious market participants.
How does multi-platform accessibility enhance trading flexibility?
The desktop version offers the best experience with extensive customization options and advanced tools. The web platform provides core features in a clean, browser-accessible interface without downloads. The mobile app enables robust charting and trading on the go, with fast syncing that automatically mirrors your desktop setup on your phone.
What advanced charting tools does Thinkorswim vs TradingView offer?
Users work with hundreds of technical indicators, studies, and drawing tools, including specialized chart types like Monkey Bars, Renko, and candlestick patterns. Up to 20 layers of notes display trends, support and resistance levels, and potential setups.
Time intervals range from tick charts to yearly views, supporting detailed pattern recognition and back-testing.
How do scanning and screening tools identify trading opportunities?
The Stock Hacker scanner filters securities by custom combinations of fundamental data, technical signals, and options metrics. Pre-built or user-defined watchlists track favourites, while alerts notify you of price moves, volume spikes, or news events as they occur.
What risk analysis capabilities help evaluate potential trades?
The Analyze tab enables "what-if" modelling of trades, volatility analysis, probability calculations, and portfolio stress tests. Users can simulate multi-leg options positions (up to eight legs) to assess performance before committing capital.
How does custom scripting with thinkScript enhance functionality?
This built-in coding environment lets you create personalized indicators, studies, and automated strategies. A condition wizard simplifies rule-building without requiring advanced programming knowledge.
What benefits does PaperMoney simulated trading provide?
This virtual account mirrors live market conditions using real data, allowing users to practice strategies, test custom scripts, or refine order tactics without financial risk.
How do real-time insights and alerts keep traders informed?
Trade Flash gives you instant notifications on analyst upgrades/downgrades, block trades, and market imbalances, plus CNBC streaming, economic calendars, and news feeds.
Community chat rooms in the mobile app let users share ideas.
What asset types and order tools are available?
Trade stocks, ETFs, options, futures, and forex with complex order types, brackets, and conditional logic. The 24/5 feature provides access to eligible securities beyond traditional market hours.
How does built-in education support trader development?
An on-demand Learning Center, video tutorials, Schwab Coaching sessions, and 24/7 trade desk assistance support users at every skill level.
Pros of Using Thinkorswim
Exceptional Depth for Active Traders
The platform's extensive toolkit of custom scripting, hundreds of studies, and advanced scanners gives experienced users the power to build repeatable edges that simpler apps cannot match.
Risk-Free Practice Environment
PaperMoney provides a realistic simulation that mirrors live conditions, allowing thorough strategy validation before risking real capital and reducing costly beginner mistakes.
Flexible Access Across Devices
The synced experience across desktop, web browser, and mobile ensures traders never miss opportunities or lose their preferred setup.
Zero Platform Cost with Competitive Trading Fees
Schwab clients get full access at no extra charge, with $0 commissions on online stock and ETF trades and $0.65 per options contract.
Expanded Trading Hours and Asset Variety
Support for 24/5 trading across multiple securities, futures, and forex markets opens opportunities outside regular market sessions and accommodates diverse strategies in a single interface.
Strong Educational Integration
Built-in resources, live news, and direct coaching help users improve without leaving the platform, transforming it into both a trading tool and a learning hub.
Cons of Using Thinkorswim
Here are its downsides for traders to know:
Steep Learning Curve for New Users
The large number of features, menus, and customization options can overwhelm beginners, requiring significant time and practice to navigate efficiently compared to streamlined retail platforms.
Desktop Version Demands Setup and Resources
The full desktop software requires downloading and launching, which consumes more computer power than web-based alternatives and may feel slower on older hardware.
Complexity Can Slow Decision-Making
Advanced tools sometimes involve multiple clicks or layered interfaces, which may frustrate traders who prefer speed and simplicity during fast-moving markets. MarketDash streamlines market analysis with an intuitive interface that keeps you informed without unnecessary complexity.
Best Suited for Experienced Traders
Casual or beginner investors may find the depth unnecessary or intimidating until they develop more sophisticated needs.
Occasional Platform-Specific Limitations
While rare, some users report that certain advanced order flows or third-party integrations feel less streamlined than specialized single-purpose software, though core execution remains reliable through Schwab.
Margin and Options Requirements Apply
Access to advanced features like futures, forex, or margin trading requires approval and minimum equity rules (such as the $25,000 pattern day trader threshold), which can limit immediate use for newer accounts.
Thinkorswim excels as a powerhouse for serious self-directed traders who value depth of analysis, customization, and practice tools within a trusted brokerage. Beginners or those seeking simpler experiences may prefer Schwab's standard platforms instead. Review current commissions, approvals, and risks directly on Schwab's site, as trading involves substantial market risk and is not suitable for everyone.
What is TradingView, and How Does It Work?
TradingView is a website-based charting platform and social network for traders and investors. It provides advanced technical analysis tools, real-time market data, and a collaborative community where users share ideas, scripts, and strategies across global financial markets.
💡 Key Point: You can access TradingView's full suite of charting tools without needing a brokerage account - just open your browser and start analyzing markets immediately.
Since its 2011 launch, the platform has expanded to serve over 100 million users worldwide, offering everything from basic price tracking to advanced custom scripting, available in any browser or dedicated apps, without requiring a brokerage account.
"TradingView has grown to serve over 100 million users worldwide since its 2011 launch, making it one of the largest financial analysis platforms globally." — TradingView Usage Statistics
🔑 Takeaway: TradingView combines three essential elements - powerful charting, real-time data, and community insights - making it a comprehensive solution for both beginner and professional traders.
How does TradingView function as a trading platform?
TradingView is a cloud-based hub for market visualization, research, and idea exchange. Users can sign up for a free account at tradingview.com to access interactive charts for stocks, ETFs, forex, cryptocurrencies, futures, commodities, bonds, and economic indicators from hundreds of global exchanges.
The interface syncs smoothly across web, desktop (Windows, Mac, Linux), and mobile apps (iOS and Android), keeping watchlists, drawings, and alerts consistent across devices.
What subscription options does TradingView offer traders?
The platform connects to over 100 supported brokers, allowing traders to place orders directly from charts. A free tier provides basic access, while paid subscriptions unlock more powerful features through tiered plans: Essential, Plus, Premium, and Ultimate.
This setup works well for casual monitoring or professional-level strategy development, with all data stored securely in the cloud for fast performance and automatic updates.
Key Features of TradingView
TradingView offers a complete set of features for both new and professional traders, combining advanced charting tools with social trading features and strong analytical capabilities.
How does TradingView's multi-chart analysis compare to other platforms?
Traders can display up to 16 synchronized charts in a single layout on higher tiers, each supporting dozens of chart types, including candlesticks, Renko, Heikin Ashi, Point & Figure, Kagi, and custom range or tick-based intervals. Drawing tools include more than 110 options, such as smart trend lines, Fibonacci retracements, and pattern recognition that automatically highlight formations.
Volume profiles, footprint charts, and time-price opportunity studies add depth for intraday and swing analysis, with every element syncing across timeframes and devices.
What makes Pine Script customization unique for traders?
The platform's Pine Script language lets users write custom indicators, strategies, and alerts using a built-in editor with autocomplete, debugging, and an extensive function library. Over 100,000 community-published scripts cover everything from simple moving average crossovers to complex options Greeks and on-chain crypto metrics.
Backtesting tools simulate historical performance with detailed reports, order fills, and profit metrics down to the second.
How do TradingView's screening tools enhance market analysis?
Special screening tools examine stocks, ETFs, cryptocurrencies, forex pairs, bonds, and more using hundreds of filters that combine technical signals, fundamentals, performance, and volume data. Our MarketDash heat maps provide quick visual snapshots of market strength by sector or asset class, while our economic calendars track earnings, dividends, and macro events with customizable alerts.
News feeds pull real-time updates from major sources like Reuters and Dow Jones directly into the interface.
What alert capabilities does TradingView offer traders?
Users can set precise prices, indicators, drawing tools, or multi-condition alerts that run on TradingView's servers even when the browser is closed. Notifications arrive through email, app push, SMS, or webhooks, with limits ranging from 20 basic alerts on lower tiers to 1,000+ advanced ones on Ultimate.
Watchlist-wide monitoring and Pine-based conditions enable automated market surveillance.
How does social trading work on TradingView?
The Ideas feed lets anyone publish chart analyses, trade setups, or educational posts for public feedback. Posts are sorted by performance, likes, and comments. Users follow top contributors, participate in discussions, and compete in risk-free challenges like The Leap for prizes.
Open-source scripts encourage collaboration, transforming the platform into a knowledge base shared by millions.
What trading and research tools complete the platform?
You can trade directly from charts when working with partner brokers across stocks, forex, futures, and crypto. Features include bracket orders, draggable order modification, and real-time position tracking. Paper Trading mode lets you practise with virtual money, and you can adjust commissions and margin settings by asset type.
Bar Replay lets you return to any moment in a chart's history to practise step by step at different speeds. Fundamental data includes financial statements, valuation ratios, yield curves, volatility surfaces, and options chains with strategy builders.
You get global coverage of thousands of instruments with institutional-grade feeds. Some feeds are available through optional paid data subscriptions.
Pros of Using TradingView
Industry-Leading Charting Depth
The variety of chart styles, indicators, and drawing tools surpasses most competitors, giving users precise control to spot patterns, test ideas, and visualize complex relationships that simpler platforms cannot match.
Thriving Collaborative Community
With over 100 million users actively sharing ideas and scripts, traders gain diverse perspectives, crowd-sourced strategies, and real-time market sentiment.
Scalable Pricing with Strong Free Tier
Casual users enjoy meaningful functionality at no cost, while paid plans progressively remove restrictions on charts, alerts, and data, making professional features accessible without excessive expense.
True Cross-Platform Experience
Instant synchronization between web, desktop, and mobile ensures traders maintain their exact workspace across devices, whether at a desk, on the move, or mid-session.
Extensive Global Market Coverage
Support for nearly every major asset class and exchange worldwide, combined with built-in screeners and calendars, eliminates the need to juggle multiple specialized websites.
Powerful Automation Through Scripting
Pine Script transforms users from passive chart watchers into active strategy developers who can automate signals, backtest rigorously, and share innovations with the community.
Educational and Practical Simulation Tools
Bar Replay, Paper Trading, and community feedback create a low-risk environment for skill-building that accelerates learning beyond static tutorials.
Cons of Using TradingView
Here are its cons for traders to know:
Significant Learning Curve
The abundance of features, menus, and customization options can overwhelm newcomers, requiring dedicated time to master advanced charting, scripting, and alert setups.
Data Limitations on Free and Lower Tiers
Real-time quotes for certain exchanges may be delayed, and premium institutional feeds require additional purchases, potentially adding costs for serious day traders or international market followers.
Advertisements and Feature Gating
The free plan displays ads and limits the number of charts, indicators, and alerts you can use simultaneously. These restrictions can interrupt your workflow until you upgrade to a paid subscription.
No Standalone Brokerage Execution
Users must connect to an external broker for real trading in most areas, adding an extra account-management step and potential compatibility issues compared to all-in-one platforms.
Potential for Information Overload
The busy interface and constant stream of community ideas may distract users who prefer simple tools, particularly during periods of rapid market price changes.
Tiered Customer Support
Getting faster help requires paying for higher subscriptions. Free and basic users face longer wait times for technical support.
Less Emphasis on Deep Fundamentals
While the platform has solid financial metrics, it prioritizes technical and social elements over detailed balance-sheet research or portfolio optimization tools available on dedicated fundamental platforms.
Related Reading
- AI Stock Technical Analysis
- What is Automated Trading
- What is Backtesting in Trading
- How To Use the Fib Retracement Tool
- Do Hedge Funds Use Technical Analysis
- What is SMA in Stocks
- Fundamental Analysis vs Technical Analysis
- How to Do Technical Analysis of Stocks
- How to Read Stocks
- Bar Chart vs Candlestick
- Day Trading Patterns
- How to Analyze a Stock Before Investing
- Volume Technical Analysis
- Double Top Chart Pattern
Do Thinkorswim and TradingView Have Any Similarities?
Both platforms offer professional-quality charting, hundreds of technical indicators, custom scripting environments, and simulated trading modes for strategy testing. They overlap where serious traders spend their time: analyzing price action, building custom studies, scanning for setups, and validating ideas before execution. You can work across desktop, web, and mobile, syncing your layouts and alerts for a smooth workflow across devices.

🎯 Key Point: Both Thinkorswim and TradingView excel in the core areas that professional traders prioritize - advanced charting, technical analysis, and strategy development.
"The ability to sync layouts and alerts across multiple devices has become essential for modern traders who need consistent access to their trading setups." — Trading Platform Analysis, 2024

💡 Tip: Take advantage of the simulated trading modes on both platforms to thoroughly test your custom strategies before risking real capital in live markets.
How does Thinkorswim vs TradingView handle chart customization?
You get deep customization on both sides. Multiple timeframes run side by side, chart types shift from candlesticks to Renko or Heikin Ashi with a click, and drawing tools (trend lines, Fibonacci retracements, channels) persist across sessions. Studies load instantly, and zooming into tick-level detail or pulling back to monthly views takes seconds. Interfaces update in real time, so patterns emerge as prices move.
Why does switching between platforms feel familiar?
Traders who switch between the two notice that muscle memory transfers. The logic of overlaying indicators, marking support levels, or setting alerts is similar enough that learning one accelerates proficiency with the other. When volatility spikes and you need to quickly confirm a breakout, the shared visual language reduces decision time.
What essential indicators do Thinkorswim vs TradingView offer?
Standard tools like moving averages, RSI, MACD, Bollinger Bands, and volume profiles load immediately on both platforms. You can adjust parameters quickly, combine them into multi-condition signals, and apply them across any symbol or timeframe without slowdown. Beyond the basics, momentum oscillators, volatility measures, sentiment gauges, and volume-weighted studies provide layers for reading market structure.
How do skills transfer between these platforms?
Skills transfer directly between platforms. Master an indicator setup on one, and it behaves identically on the other, keeping your strategy logic intact when switching. This consistency matters when refining entries or exits: you test the same signals against the same data, reducing variables that cloud results.
What do traders say about technical analysis depth?
Community feedback consistently gives both above 9/10 scores for technical depth. Traders report that shared libraries enable them to compare setups across different platforms, filtering out false positives before committing capital.
How do scripting languages turn trading ideas into automated tools?
ThinkScript and Pine Script let you write custom indicators, strategies, or scanners from scratch. You set up the logic, test it against historical data, and use scripts that run continuously or send alerts when conditions match.
Visual editors and quick-test loops enable non-programmers to work more easily, while experienced programmers value the freedom to build custom advantages.
What automation capabilities does Thinkorswim vs TradingView offer traders?
You can automate repetitive pattern recognition, create signals based on multi-factor conditions, or share scripts within communities for feedback. Both platforms emphasize rapid iteration: write a few lines, see the chart update, refine, and repeat.
Traders who code on one platform often experiment on the other. The conceptual framework—define conditions, test, deploy—applies universally, accelerating skill growth across both tools.
How does paper trading mirror real market conditions?
PaperMoney on Thinkorswim and TradingView's strategy tester or replay features let you execute practice trades using real-time or historical data with virtual funds. The simulators handle order types, slippage estimates, and multi-leg setups, making the practice environment behave like a live account.
What skills can you develop with Thinkorswim vs TradingView simulators?
You test complex ideas, check that entry and exit logic work, and build muscle memory for placing orders before risking real money. New traders learn how markets work, while experienced traders test strategies during unusual conditions to identify problems early.
Users often start by practising on one platform's simulator, then move to live trading on another platform. This demonstrates that practice tools help traders learn transferable skills and avoid costly mistakes while accelerating the learning process.
How do Thinkorswim vs TradingView scanners filter opportunities
Both have advanced screeners that filter thousands of symbols by technical criteria, fundamentals, volume spikes, or custom script logic. You set thresholds, sort results dynamically, and export watchlists that sync across sessions. Alerts notify you when securities hit price targets, volume thresholds, or multi-condition triggers you define.
The tools save hours of manual chart review by surfacing setups matching your exact criteria. Whether scanning for breakouts, oversold bounces, or unusual options activity, filters run continuously in the background, delivering fresh results as markets evolve.
Why do traders cross-verify signals between platforms
Traders often run the same scans on both platforms to verify signals. Seeing the same opportunities appear twice increases confidence and filters out noise that obscures high-probability setups.
Most platforms assume that more signals yield better trades. Both Thinkorswim and TradingView offer substantial depth, but this can fragment your focus across dozens of watchlists, conflicting indicators, and constant alerts. Market analysis curates opportunities through expert review and AI pattern detection, letting you validate fewer, higher-probability trades aligned with your risk tolerance and timeframe. Curated insights alongside your technical setup help you prioritise what matters, filter distractions, and act on setups that fit your strategy across stocks, options, and futures.
Access That Follows You Everywhere
Desktop apps, web interfaces, and mobile versions keep core features consistent across devices. Watchlists, alerts, and chart layouts sync automatically, so switching between a laptop and phone never disrupts your workflow.
This flexibility suits traders who move between locations, allowing you to check positions during lunch, adjust stops on the commute, or review overnight moves before the opening bell without losing your preferred setup.
Reviews emphasize how this accessibility boosts engagement. Users report staying connected longer because transitions between devices feel effortless, reducing friction that might cause them to miss opportunities or delay decisions.
Where the Overlap Matters Most
The similarities focus on what active traders do daily: reading charts, testing ideas, scanning for setups, and validating logic before risking capital. Both platforms deliver professional tools that once lived only on institutional desktops and are now accessible to anyone with an internet connection. You can experiment on one, refine on the other, and carry skills forward without starting from scratch.
How can you use Thinkorswim vs TradingView together strategically?
Understanding this common ground changes how you pick a platform. Rather than seeing them as competitors, you recognise them as complementary tools. You might use one to execute trades and the other to check social signals, run scans on both to compare information, or practise on one while trading live on the other.
The flexibility transforms potential confusion into a strategic advantage. Skills you build transfer across platforms, so your investment in learning compounds rather than fragments.
What differences should you focus on next?
But these similarities tell only half the story; where the platforms differ, you must consider which shape best fits your workflow.
Related Reading
- AI Quantitative Trading
- AI Swing Trading
- Stock Sentiment Analysis
- Penny Stock Analysis
- Volume Analysis Trading
- How to Find Stocks to Day Trade
- How to Scan Stocks for Swing Trading
- Best Stock Trading Strategies
- Best Indicators for Day Trading
- Technical Analysis Trading Strategies
- Best Stock Indicators for Swing Trading
- Trading Exit Strategies
Thinkorswim vs TradingView Differences
Thinkorswim is built around brokerage execution with Schwab, offering professional-grade options analytics, direct order routing, and desktop power for complex multi-leg strategies. TradingView focuses on visual speed and social discovery through a browser-first design, global asset coverage, and a scripting community sharing thousands of ready-made strategies. The difference comes down to execution depth, asset breadth, and whether you prefer integrated brokerage control or the ability to connect with multiple brokers.
- Primary Focus: Thinkorswim excels in options and execution; TradingView leads in charting and social networking.
- Platform Type: Thinkorswim is desktop-heavy; TradingView is browser-first.
- Options Analytics: Thinkorswim offers pro-grade tools; TradingView is basic.
- Broker Support: Thinkorswim is Schwab only; TradingView connects to multiple brokers.
- Community: Thinkorswim has limited shared scripts; TradingView has thousands of strategies.
- Asset Coverage: Thinkorswim is US-centric; TradingView covers global markets.
🔑 Takeaway: Choose Thinkorswim if you need advanced options trading tools and prefer integrated brokerage execution. Choose TradingView if you want flexible broker connections and access to a global trading community.
"The key difference lies in execution depth versus asset breadth - Thinkorswim excels at complex options strategies while TradingView dominates in visual analysis and global market access."
💡 Pro Tip: Serious options traders often find Thinkorswim's direct order routing and professional analytics worth the single-broker limitation, while swing traders and international investors prefer TradingView's flexibility and multi-broker connectivity.
How does Thinkorswim vs TradingView handle order execution?
Thinkorswim puts order entry directly into every chart, scan, and analysis tool. Click a price level, and the order ticket populates with routing options, bracket logic, and conditional triggers through Schwab's infrastructure. Advanced order types such as OCO (one-cancels-the-other), OTO (one-triggers-the-other), and trailing brackets with percentage or dollar offsets enable multi-step execution plans before the first fill.
The platform handles everything from simple market orders to complex options spreads with up to eight legs, all routed through a single brokerage relationship that consolidates statements, tax documents, and margin calculations.
What brokerage integration options does TradingView offer?
TradingView connects to over 100 brokers through API integrations, allowing you to choose execution partners based on fees, asset access, or geographic availability. You place trades from charts using drag-and-drop stops and targets, though order logic depends on each broker's capabilities rather than a unified system.
This suits traders who want a separation between analysis and execution, or who need access to international brokers that Schwab doesn't support. The tradeoff appears with complex conditional orders: not every broker integration supports the full range of logic that TradingView's interface suggests, creating gaps between what you design and what executes.
Options Trading Depth and Risk Modeling
Thinkorswim provides strong options tools that professional traders use. The Analyze tab shows potential profit or loss at different prices, as time passes, and when volatility changes, before you commit capital. It displays Greeks (delta, gamma, theta, vega) in real time as underlying asset prices move.
How do Thinkorswim vs TradingView handle complex options strategies?
You can model iron condors, butterflies, calendars, and diagonals using visual risk graphs that update in real time. Stress-test positions against historical volatility to see how similar setups performed during past earnings or macro events. Option Hacker scans thousands of contracts by implied volatility rank, changes in open interest, or profit probability, surfacing opportunities that match specific criteria, such as high premium with low delta exposure.
What capabilities does TradingView provide for active traders?
TradingView offers basic options chains with bid-ask spreads, volume, and open interest, plus improved analytics for single-leg positions, but lacks the multi-leg strategy builders and probability calculators that active options traders depend on. You can chart options prices and set alerts on strike levels, yet the platform doesn't simulate complex spreads or display real-time Greeks across multiple expirations.
The U.S. Chicago PMI jumped from 54.0 to 57.7 in February 2025, reflecting stronger manufacturing sentiment that drives volatility shifts that options traders monitor closely. Traders who build income strategies around volatility or hedge portfolios with multi-leg structures find TradingView insufficient as a primary options platform.
What assets can you trade with Thinkorswim vs TradingView?
Thinkorswim focuses on U.S. stocks, options, futures contracts traded on CME and similar exchanges, and major forex pairs, offering deep liquidity and tight spreads in these areas. International stocks are limited, and cryptocurrency access is restricted to Bitcoin and Ethereum futures rather than direct coin purchases.
How does TradingView's global market coverage compare?
TradingView covers more than 100,000 instruments across global stock exchanges, forex pairs from major and exotic currencies, commodities, indices, bonds, and spot cryptocurrency markets, including altcoins that traditional brokerages ignore. You can switch from analysing S&P 500 futures to comparing emerging market equities to tracking on-chain Bitcoin metrics without changing platforms. Real-time feeds for some international markets require additional subscriptions beyond base pricing.
How does Thinkorswim vs TradingView pricing structure differ?
Thinkorswim charges no platform fees with a Schwab account, bundling advanced features, real-time U.S. market data, and tools like PaperMoney and thinkScript into the standard brokerage relationship. You pay $0 for stocks and ETFs, $0.65 per options contract, plus exchange fees for futures or forex. This eliminates monthly software costs and makes professional tools accessible without subscription expenses layered on top of trading fees.
What subscription tiers does TradingView offer?
TradingView offers five subscription levels: free (with ads and limited tools), Essential ($14.95/month), Plus ($29.95/month), Premium ($59.95/month), and Ultimate ($99.95/month). Higher tiers provide more simultaneous charts, server-saved alerts, historical data, and faster customer support. Real-time data for some exchanges and broker connections may incur an extra cost. This structure allows casual traders to start for free while encouraging serious traders to upgrade for features like multiple chart layouts and advanced backtesting, creating ongoing costs beyond trading commissions.
How do Thinkorswim vs TradingView handle social features?
Thinkorswim keeps social features simple, focusing on Schwab's educational library, webinars, and coaching sessions rather than user-generated content. You can join chat rooms within the mobile app to discuss markets with other Schwab clients, but there's no public idea feed, script marketplace, or mechanism to follow specific analysts or share annotated charts outside private channels.
What makes TradingView's community platform unique?
TradingView builds a social network around charting, where millions of users publish trade setups, educational posts, and market commentary tagged by asset and strategy. You follow contributors whose analysis matches your approach, upvote useful ideas, and track which analysts called moves accurately over time.
The open-source Pine Script library hosts over 100,000 community indicators and strategies you can apply immediately or modify for your needs. Competitions and leaderboards gamify skill development, transforming solitary chart work into a collaborative learning environment.
How can you filter community insights effectively?
Most platforms promise that more data, indicators, and community ideas will give you an edge, yet the volume scatters your focus across conflicting signals and social feeds that distract more than clarify. You spend hours tweaking scans and reading trade ideas, only to realize you're chasing setups outside your risk tolerance or timeframe.
Market analysis curates high-probability opportunities through expert review and AI pattern detection, filtering thousands of signals to those that align with specific strategies. Our MarketDash insights, alongside your technical platform, help you prioritize what matters, validate trades with greater conviction, and act on setups that align with your capital constraints and goals.
How does Thinkorswim vs TradingView handle custom scripting?
Thinkorswim uses thinkScript, a proprietary language for building custom indicators, scans, and strategy studies. The language integrates with Schwab's data feeds and order logic, enabling conditional alerts or automated scans based on multiple factors. A visual condition wizard accommodates non-coders, using drop-down menus to build "if-then" rules without writing code. Scripts remain private unless shared manually; the platform lacks a public marketplace, so users collaborate through external forums or direct file exchanges.
What makes TradingView's scripting ecosystem different?
TradingView uses Pine Script, a language that is easier to learn and has syntax similar to Python. It offers extensive documentation, autocomplete, and instant chart previews. The built-in Strategy Tester validates your strategy against years of tick data, generating equity curves, drawdown reports, and trade-by-trade logs so you can test your logic before risking real money. You can share scripts publicly, keep them private, or monetise them through TradingView's marketplace. This open system accelerates learning: you can examine how experienced coders solve problems, modify their work, and iterate faster than starting from scratch.
How does Thinkorswim vs TradingView handle desktop versus browser performance?
Thinkorswim requires desktop installation and performs best on multi-monitor setups, providing strong stability during high-volume trading sessions. The interface offers customizable workspaces where you can arrange dozens of widgets, charts, and watchlists, then save layouts for instant access.
Switching between saved workspaces happens in seconds, ideal for traders who separate pre-market scanning, active trading, and post-market review. The software demands more hardware resources, with slower startups and occasional lag on older machines when running multiple complex scans simultaneously.
What flexibility advantages does browser-based trading offer?
TradingView runs entirely in the browser with no installation needed, loading instantly on any device with internet access. Cloud syncing keeps your layouts, alerts, and scripts consistent across devices: start analysis on a laptop, check positions on your phone, and resume on a different computer without having to reset.
The lightweight design enables faster chart loading and smooth cross-device switching, though the browser-based platform limits the number of concurrent open charts on lower-tier plans compared to Thinkorswim's unlimited desktop windows.
How does Thinkorswim vs TradingView mobile functionality compare?
Thinkorswim's mobile apps handle core charting, order entry, and account management, though they don't match the desktop experience. Complex multi-leg options strategies and detailed risk analysis feel cramped on smaller screens, and some advanced indicators underperform on smaller screens.
The apps work for quick checks, adjusting stops, or straightforward trades, but serious analysis requires a desktop platform.
Which platform offers better mobile trading capabilities?
TradingView's mobile apps function identically to the desktop version, supporting full charting with indicators, drawing tools, alerts, and Pine Script execution. Cloud syncing ensures changes made on mobile appear immediately on the desktop.
Traders use TradingView mobile as their main tool while travelling, whereas Thinkorswim mobile serves primarily for monitoring positions.
How do Thinkorswim vs TradingView handle real-time data access?
Thinkorswim includes real-time data for U.S. stocks, options, and major futures at no extra cost through Schwab, with institutional-grade accuracy and minimal latency during market hours. International data or specialized feeds, such as Level II quotes, may require additional subscriptions, though the core domestic package covers most active traders' needs. Data consistency across charts, scans, and order entry reduces discrepancies that can cause execution errors.
TradingView provides delayed data on the free plan (15-minute lag for U.S. equities) and offers real-time feeds through paid subscriptions, with costs varying by exchange and asset class. Some international markets require separate data packages, adding $10 to $50 monthly.
Which platform offers better value for data costs?
You might pay for TradingView Premium, plus additional exchange fees, to match the real-time access Thinkorswim includes by default, though TradingView's global reach covers markets that Schwab doesn't reach.
The critical difference between these platforms is which one matches how you trade and where your advantage lies.
Which One Should You Choose?
Choose Thinkorswim if you trade U.S. markets actively, rely on advanced options strategies, and want execution, analysis, and risk modeling unified in one place, without monthly software costs. Choose TradingView if you analyse global markets, value community insights, need browser-based flexibility across devices, or prefer separating charting from brokerage relationships while accepting subscription fees for premium features.

🎯 Key Point: Your trading style and market focus should drive your platform choice - active U.S. options traders benefit most from Thinkorswim's integrated approach, while global market analysts and social traders thrive with TradingView's flexibility.
"The best trading platform is the one that matches your specific trading needs and market focus, not necessarily the most feature-rich option." — Trading Platform Analysis, 2024

💡 Tip: Consider starting with TradingView's free tier to test its charting capabilities and community features before committing to a subscription, especially if you're primarily focused on analysis rather than execution.

Which platform works better for day trading?
Day traders who buy and sell stocks or options quickly in the U.S. market benefit from Thinkorswim's fast order routing, bracket automation, and real-time Greeks that update with every price change. You spot a breakout, click the chart, and the order fills with your preferred logic already loaded from saved templates. Speed matters when seconds separate profitable trades from losses.
How do TradingView vs Thinkorswim serve swing traders?
Swing traders who hold positions for days or weeks benefit from TradingView's clean visual interface and flexible alerts. Mark key levels once, set up server-side notifications, and step away knowing the platform watches continuously without keeping your browser open. The mobile experience lets you check setups during lunch or adjust stops from anywhere, while the social feed surfaces ideas you might miss scanning alone.
How does Thinkorswim vs TradingView handle options complexity?
Traders building multi-leg income strategies around volatility need Thinkorswim's Analyze tab, which models risk across price ranges, time decay, and shifts in implied volatility. The Greeks display in real time, and the probability calculator shows win rates based on historical patterns. You can simulate an iron condor during earnings season, stress-test it against past volatility spikes, and identify exactly where the position breaks even or loses money.
TradingView's options chains display basic bid-ask data but lack the strategy builders and probability tools that serious options traders depend on daily.
Which platform offers clearer charting of price action?
Traders who prioritize clear charts over complicated options find TradingView's interface faster and easier to customize. The drawing tools snap intelligently to price swings, the indicator library loads instantly, and the layout functions smoothly on smaller screens.
You spend less time setting things up and more time analyzing, which matters when reviewing dozens of setups across multiple timeframes. The platform excels at pattern recognition and visual storytelling, making it ideal for traders whose edge comes from reading price action rather than modelling derivatives risk.
Which platform offers better global market coverage for Thinkorswim vs TradingView?
Traders who follow international stocks, unusual currency pairs, or cryptocurrency markets beyond Bitcoin futures need TradingView's coverage of over 100,000 instruments across global exchanges. You can compare emerging market stocks, track on-chain metrics for altcoins, and analyse commodities that traditional brokerages don't list, all within one interface.
The breadth works well for macro-focused strategies or traders who arbitrage across regions, though real-time data for some exchanges may require additional subscriptions, increasing costs beyond base pricing.
How does domestic market depth compare in Thinkorswim vs TradingView?
Traders who focus on U.S. stocks, options, and major futures benefit from Thinkorswim's strong domestic features and zero platform fees. Real-time U.S. market data is included, and execution quality through Schwab's routing matches institutional standards.
The focus on domestic assets eliminates fragmented data subscriptions and tighter integration between analysis and execution streamlines workflow.
Community Learning Versus Independent Research
Traders learn by watching others succeed on TradingView's social network, where millions share setups, scripts, and market commentary tagged by strategy and asset. You can follow analysts whose style matches yours, view performance tracking that shows accuracy over time, and modify open-source Pine Scripts to fit your approach. Crowd-sourced validation helps you spot patterns you might miss on your own, while competition leaderboards gamify skill development through public accountability.
How does Thinkorswim vs TradingView support independent research?
Traders who prefer independent research appreciate that Thinkorswim lacks community features, helping them stay focused. You can access Schwab's educational library, coaching sessions, and news feeds without navigating public idea streams that may not align with your strategy. The platform prioritises your own analysis over others' opinions, making it well-suited to traders with established, successful approaches.
Which platform prevents information overload better?
Most platforms assume that more features yield better decisions. Thinkorswim offers execution depth, TradingView delivers charting breadth, yet both can overwhelm you with data if you don't know which signals matter. You end up setting up scans, adding indicators, and tracking watchlists that contradict each other.
Our Market analysis at MarketDash organizes high-probability opportunities through expert review and AI pattern detection, filtering thousands of signals to those aligned with specific strategies, such as weekly opportunities, top-ranked picks, or long-term wealth-building. Curated insights alongside your technical platform help you prioritize what matters, validate fewer trades with higher conviction, and act on setups matching your capital constraints and timeframe across stocks, options, and futures.
How does Thinkorswim vs TradingView pricing compare for traders?
Thinkorswim charges nothing for platform access with a Schwab account. You pay standard commissions: $0 for stocks and ETFs, $0.65 per options contract, plus exchange fees for futures or forex. This model suits traders seeking professional tools without subscription costs, though it requires maintaining a Schwab relationship and limits flexibility if you prefer multiple brokers or international partners.
What subscription model does TradingView use?
TradingView offers a free version with ads and limited features, plus paid plans that unlock additional charts, alerts, and data history. Real-time data for certain exchanges and broker integrations incur extra fees. Costs can exceed Thinkorswim's zero platform fee if you need premium features and multiple data feeds, but TradingView's compatibility with any broker makes up for it when Schwab doesn't meet your needs.
Which platform works better for desktop trading setups?
Traders with dedicated setups and stable internet benefit from Thinkorswim's desktop power. The software handles dozens of charts simultaneously, complex scans, and real-time data streams without lag. Saved workspaces let you switch between pre-market scanning, active trading, and post-market review instantly. The tradeoff: slower startups and less portability than browser-based alternatives.
How do Thinkorswim vs TradingView handle mobile trading?
Traders who move between locations benefit from TradingView's cloud-native design. Log in through any browser, and your layouts, alerts, and scripts appear exactly as you left them across laptops, tablets, and phones. The lightweight architecture renders charts faster and handles device switches smoothly, making it ideal for traders checking positions during commutes or travelling without losing full functionality.
The choice isn't about which platform offers more tools, but which aligns with how you trade and where your edge lives.
What complements both platforms for fundamental analysis?
For investors combining technical charting with fundamental insights, MarketDash integrates well with either platform. MarketDash is an AI-powered investment platform that delivers detailed stock analysis, including AI-generated SWOT reports, insider trading data, hedge fund activity tracking, Wall Street analyst opinions, and key fundamental metrics. It provides curated stock picks across short- to medium-term opportunities, top-ranked selections based on fundamentals, technicals, and market positioning, and long-term wealth-building portfolios.
Traders using Thinkorswim for execution or TradingView for charts can use MarketDash's expert AI-driven reports to inform stock selection and holding periods, adding fundamental confidence to technical setups without replacing their primary platform.
Related Reading
- Ninjatrader Vs Tradingview
- Stock Market Technical Indicators
- Tradovate Vs Ninjatrader
- Tradestation Vs Ninjatrader
- Trendspider Vs Tradingview
- Tools of Technical Analysis
- Tradestation Vs Thinkorswim
- Tradingview Alternative
- Ninjatrader Vs Thinkorswim
Try our Market Analysis App for Free Today | Trusted by 1,000+ Investors
Both platforms excel at charting, scanning, and execution. However, depth without good organization often means spending hours checking setups, questioning valuations, or missing undervalued opportunities. This happens because focus remains on the technicals while fundamentals slip by unnoticed.

Market analysis rounds out your workflow with AI-driven stock grading, real-time valuation scans, insider buying alerts, and earnings breakdowns to help you spot high-potential opportunities rather than overvalued traps. Our MarketDash platform streamlines the fundamental research that complements technical charting, giving beginners confidence to build solid portfolios and experienced traders an efficient way to find undervalued gems before the crowd. Start your free trial today and see why thousands of investors trust MarketDash to simplify stock research and boost their edge beyond charting alone.
Get Market News Alerts
Real-time alerts on price moves, news, and trading opportunities.
Join 20,000+ investors. No spam, ever.
Featured Articles
View all news
Tech Stocks Take a Third Hit as China's AI Surprise Spooks the Market, Oil Jumps to $81

Trump, Elon and the Coming AI “Black Swan” (Ad)

Trump Declared the Iran Ceasefire 'Over': These 7 Energy Stocks Have Been Cashing In Ever Since

GE Aerospace Crushed It. Larry Culp Says 'No Victory Laps' Anyway
Inflation Cooled, AI Stocks Melted: The Week Wall Street Couldn't Catch a Break

Inside: Pre-IPO Ticker + The Next Elon Musk? (Ad)

Semiconductor Stocks Are Getting Crushed. This Analyst Says That's a Buying Opportunity.