7 Best AI Stock Technical Analysis Tools in 2026
MarketDash Editorial Team
Author
Consider this: you're staring at candlestick charts at midnight, trying to decode patterns while the market moves without you. Manual technical analysis requires hours of chart reading, indicator tracking, and pattern recognition, which drain your energy and often lead to missed opportunities. This guide cuts through the noise to help you discover AI Stock Technical Analysis tools that transform how you approach trading, giving you the power to make faster, smarter, and more accurate trading decisions without endless hours of manual chart analysis.
That's where MarketDash steps in with intelligent market analysis designed for traders who value their time. The platform processes vast amounts of market data, identifies technical patterns, and delivers actionable insights so you can focus on executing trades instead of hunting for signals. MarketDash removes the guesswork from your trading strategy, providing clear analysis to help you spot opportunities as they emerge.
Summary
- Manual technical analysis requires hours of chart reading and pattern recognition, which most traders can't sustain while competing with algorithmic systems that process thousands of securities simultaneously. According to LuxAlgo's 2025 analysis, AI can process thousands of data points per second, fundamentally altering what becomes possible in market analysis. This speed advantage matters most during volatility spikes or sector rotations when opportunities appear and disappear within minutes, long before manual analysis can confirm patterns across even a handful of stocks.
- Emotional biases cost traders more than technical skill gaps. Confirmation bias leads you to see bullish setups where you want them, while dismissing volume divergence that signals institutional selling. Fear and greed distort support and resistance levels you'd normally respect during calmer conditions. AI systems evaluate setups without psychological bias, weighing patterns against historical outcomes under comparable conditions and assigning probabilities regardless of how compelling charts appear in isolation. This separation of disciplines creates a consistency advantage that distinguishes profitable systematic approaches from discretionary trading, which is prone to emotional swings.
- Machine learning models identify multidimensional relationships that are invisible to manual chart review. A traditional analyst might notice a stock bouncing at its 50-day moving average, while AI would recognize that this support is significantly stronger when combined with oversold RSI readings below 30, declining put-to-call ratios, and insider buying within the previous two weeks. These layered correlations exist in market data but require monitoring too many variables simultaneously for practical human analysis. The individual factors mean little, but specific combinations create statistical edges that compound across hundreds of trades.
- AI stock technical analysis now handles 89% of the world's trading volume according to LiquidityFinder research, yet the most successful implementations still incorporate human judgment around business quality and competitive positioning. Algorithms detect institutional accumulation patterns but can't distinguish whether smart money recognizes genuine value or is chasing late-cycle momentum. Black swan events highlight another limitation: models trained on historical patterns struggle when genuinely unprecedented scenarios arise that fall outside their training data. The technology addresses scale issues, while human expertise provides context that machines still miss.
- Combining AI technical analysis with fundamental screening, sentiment monitoring, or factor-based strategies creates hybrid systems that capture opportunities single-method approaches miss. Fundamental screens identify companies with strong earnings growth and reasonable valuations, then AI monitors these candidates for optimal technical entry points when price action confirms accumulation. This layered approach prevents chasing every technical setup that appears while ensuring you're positioned in businesses that deserve capital when both quantitative signals and qualitative judgment align.
- MarketDash market analysis combines AI-powered pattern recognition with expert curation to filter thousands of technical signals into opportunities that meet both quantitative criteria and qualitative assessments across different investment timeframes.
What is AI Stock Technical Analysis, and How Does It Differ From Traditional Stock Technical Analysis?

AI stock technical analysis uses machine learning algorithms to analyze price movements, volume patterns, and market signals, leveraging computational power far beyond human capability. Traditional technical analysis relies on chart patterns and indicators interpreted manually by traders, while AI-driven approaches automate pattern recognition across thousands of securities simultaneously and learn from outcomes to refine predictions. The fundamental difference isn't just speed, it's the ability to process complexity at a scale that transforms noise into signal.
Traditional methods served traders well for decades. You'd study candlestick formations, draw trendlines, calculate moving averages, and make educated guesses about where prices might head next. This approach demanded experience, discipline, and countless hours staring at charts. The problem arises when markets move faster than human analysis can keep up with. By the time you've identified a head-and-shoulders pattern across ten stocks, algorithmic systems have already scanned ten thousand and executed trades based on probabilities you haven't finished calculating.
Processing Power That Changes the Game
AI can process thousands of data points per second, a capability that fundamentally alters what's possible in market analysis. That's not just faster chart reading. It's the difference between analyzing price action on a single timeframe versus simultaneously evaluating multiple timeframes, correlating sector movements, tracking institutional flows, and factoring in sentiment shifts from news sources, all while your coffee is still hot.
Traditional technical analysis operates within human constraints. You might track twenty stocks closely, maybe fifty if you're disciplined. You'll apply your favorite indicators (RSI, MACD, Bollinger Bands) and make decisions based on patterns you've learned to recognize. This works until market conditions shift in ways your experience hasn't prepared you for. The 2020 volatility spike taught many traders that familiar patterns behave differently when unprecedented factors enter the equation.
What AI Actually Sees
Machine learning models don't just replicate human chart analysis faster. They identify relationships invisible to manual review. A traditional analyst might notice that a stock tends to bounce at its 200-day moving average. An AI system recognizes that this support level strengthens when sector rotation occurs during specific Federal Reserve policy cycles, but weakens when institutional ownership drops below 60% while retail sentiment spikes on social platforms. That's not guesswork. It's pattern recognition across dimensions humans can't practically monitor.
The learning component separates AI from simple automation. Traditional technical indicators remain static. A 14-period RSI calculation today works exactly as it did in 1978, when Welles Wilder introduced it. AI models evolve. They test strategies against historical data, identify which conditions produce accurate signals versus false positives, and adjust their factor weights accordingly. When a pattern that worked for three years suddenly fails, the system adapts. Human traders often don't, not until losses force the lesson.
The Bias Problem Nobody Mentions
Emotions sabotage technical analysis more than most traders admit. You spot a bullish flag pattern on a stock you've been watching for weeks. Confirmation bias kicks in. You see what you want to see, dismissing volume signals that suggest weakness because you've already decided this setup looks perfect. AI doesn't get excited about setups or frustrated by missed opportunities. It evaluates probabilities without the psychological baggage that causes traders to hold losers too long and cut winners too early.
Traditional analysis also suffers from recency bias. Recent market behavior disproportionately influences human judgment. After growth stocks surged for months, traders are seeing bullish setups everywhere, even as valuation metrics flash warnings. Machine learning models weigh historical data systematically, preventing recent trends from overwhelming longer-term statistical relationships.
Where Human Judgment Still Matters
AI struggles with context that falls outside quantifiable data. When a CEO makes an offhand comment during an earnings call that signals strategic uncertainty, experienced analysts catch the subtext. Algorithms parse the words but miss the hesitation, the departure from prepared remarks, the body language visible on video. Markets sometimes move on nuances machines can't yet decode.
Black swan events expose another limitation. AI models train on historical patterns, building confidence in relationships that have held true across thousands of scenarios. When something genuinely unprecedented occurs (a global pandemic that shuts down economies, a geopolitical shock that reshapes energy markets), models extrapolate from the closest historical analogs available. Those analogs often prove inadequate. Human traders who understand second-order effects and can reason through novel situations add value that machines can't replicate.
Speed Versus Understanding
Traditional technical analysis forces you to understand why patterns work. Drawing trendlines by hand, calculating indicators manually, and studying price action develop intuition about market structure. You learn to recognize when volume confirms price movements versus when divergences signal potential reversals. This foundational knowledge helps you adapt when conditions change.
AI-driven analysis can become a black box. The system generates buy and sell signals, but the logic connecting inputs to outputs remains opaque. Some traders execute recommendations without understanding the underlying reasoning, which works fine until it doesn't. When market dynamics shift, and signals start to fail, you're flying blind without the conceptual framework that traditional analysis provides.
Most traders face a version of the same problem. Markets generate more data than any individual can process, yet purely algorithmic approaches miss the contextual judgment that separates good trades from great ones. Platforms like MarketDash address this by combining AI-powered pattern recognition with expert curation, filtering thousands of technical signals down to opportunities that meet both quantitative criteria and qualitative judgment. The technology addresses the scale problem, while human expertise addresses the context problem.
Different Tools for Different Timeframes
Short-term traders benefit most from AI's speed advantage. When you're scalping price movements that last minutes or hours, milliseconds matter. Algorithms detect momentum shifts and execute trades faster than manual analysis allows. Day traders using traditional methods compete with systems that react to order-flow changes before human eyes register the movement.
Long-term investors gain less from speed but benefit from AI's ability to monitor portfolio-wide technical health. Instead of manually reviewing charts for dozens of holdings, systems can alert you when any position breaks below key support levels or develops concerning patterns. This frees attention for fundamental research and strategic allocation decisions rather than constant technical surveillance.
The question isn't whether AI replaces traditional technical analysis. It's how the two approaches complement each other across different trading objectives and timeframes. Speed matters for some strategies, depth of understanding matters for others, and the best outcomes often come from knowing which tool fits which situation.
But understanding the differences only matters if you know why you'd choose one approach over the other in the first place.
Why Use AI in Stock Technical Analysis?
-1-400x300.webp)
AI transforms technical analysis from a manual, time-intensive process into a systematic approach that scales across thousands of securities simultaneously while eliminating the emotional biases that derail human judgment. The technology accelerates chart reading. It reveals multi-dimensional patterns across price, volume, and market structure that remain invisible to manual review, then adapts as market conditions evolve rather than relying on static rules written decades ago.
Speed That Actually Changes Outcomes
According to TopDevelopers.co's 2023 analysis, AI algorithms can process millions of data points in seconds, fundamentally altering what is possible in real-time market analysis. That's not just faster execution. It's the difference between manually monitoring 20 stocks versus scanning entire sectors for technical setups while simultaneously tracking volume anomalies, institutional order flow, and correlation breakdowns across asset classes. By the time you've finished analyzing one chart pattern, algorithmic systems have evaluated thousands and identified the highest-probability setups based on historical success rates under similar conditions.
This speed advantage compounds when markets move fast. During volatility spikes or sector rotations, opportunities appear and disappear within minutes. Manual analysis can't keep pace. You're still confirming a breakout in your third stock, even though the best entries have already filled. AI systems detect momentum shifts as they develop, flagging setups that meet your criteria before price action becomes obvious to the broader market.
Removing the Bias That Costs Money
Traders describe themselves as financial noobs incapable of breaking down charts, highlighting how complexity barriers prevent effective manual technical analysis. But even experienced analysts fall victim to psychological traps that AI sidesteps entirely. You spot a bullish engulfing candle on a stock you've been watching for weeks. Confirmation bias takes over. You see supporting evidence everywhere while dismissing volume divergence that suggests institutional selling. The pattern looks perfect because you need it to be perfect.
AI evaluates the same setup without attachment. It weighs the bullish candle against historical outcomes when similar patterns appeared during comparable volume conditions, sector momentum, and broader market context. If those historical analogs produced false breakouts 60% of the time, the system assigns appropriate probability regardless of how compelling the chart looks in isolation. No excitement about potential gains, no frustration over missed opportunities, just a statistical assessment of what typically happens next.
Fear and greed distort technical signals more than most traders admit. During downturns, panic selling overrides support levels you'd normally respect. In euphoric markets, you ignore overbought readings because momentum feels unstoppable. These emotional swings create the consistency problem that separates profitable traders from everyone else. Machine learning models maintain discipline that humans struggle to sustain, applying the same analytical framework whether markets are crashing or surging.
Pattern Recognition Beyond Human Capacity
Deep learning algorithms detect intricate chart patterns, support and resistance levels, and multi-factor correlations that even experienced analysts miss. This isn't about recognizing head-and-shoulders formations faster. It identifies that a particular candlestick pattern, combined with specific volume characteristics and sector rotation dynamics, has historically preceded 15% moves within three weeks, but only when institutional ownership is between 55-70% and retail sentiment remains neutral on social platforms.
Those layered relationships exist in the data, but human analysis can't practically monitor enough variables simultaneously to spot them. You might notice that a stock bounces at its 50-day moving average. An AI system recognizes that this support strengthens significantly when the bounce coincides with oversold RSI readings below 30, declining put-to-call ratios, and insider buying within the previous two weeks. The individual factors mean little. The combination creates a statistical edge.
This capability extends to detecting subtle pattern degradation before it becomes obvious. Traditional technical analysis treats indicators as static. A MACD crossover signals the same thing today as it did last year. Machine learning models track how well each signal performs under evolving conditions and adjust their confidence accordingly. When a pattern that worked reliably for eighteen months starts generating false signals, the system recognizes the shift and recalibrates. Human traders often don't adjust until losses force them to learn.
Systems That Learn From Mistakes
Markets change. Volatility regimes shift, correlations break down, and strategies that worked beautifully stop working without warning. Traditional technical indicators can't adapt. The math behind a 14-period RSI calculation remains fixed regardless of whether market structure resembles 2019, 2020, or 2023. You're applying tools designed for different conditions, hoping patterns behave as they used to.
Machine learning models evolve with the data. They test strategies against historical outcomes, identify which market conditions produced accurate signals versus false positives, and then weight factors accordingly. After analyzing thousands of scenarios in which moving average crossovers preceded sustained trends versus head fakes, the system learns which additional confirmation factors (volume patterns, sector strength, breadth indicators) distinguish high-probability setups from traps.
This continuous refinement addresses a problem that manual analysis can't solve at scale. You might recognize that your favorite setup stopped working and adjust your approach. But you're making that adjustment based on recent experience with a limited sample size across a handful of stocks. AI models evaluate pattern performance across thousands of securities across multiple market cycles, identifying degradation signals before they appear in your personal trading results.
Most traders face the same challenge. Markets generate more technical signals than any individual can evaluate, yet purely algorithmic approaches miss the contextual judgment that separates noise from genuine opportunity. Platforms like MarketDash address this by combining AI-powered pattern recognition with expert curation, filtering thousands of technical signals down to setups that meet both quantitative criteria and qualitative assessment. The technology addresses the scale problem, while human expertise provides the context that machines still miss.
Monitoring That Never Sleeps
According to HeyGoTrade's 2025 analysis, AI enables 60% faster analysis through continuous market surveillance, capturing opportunities that human traders inevitably miss. Global markets operate across time zones. Technical setups develop during Asian trading hours, European sessions, and after-hours U.S. markets when most retail traders aren't watching. You can't maintain 24/7 vigilance without burning out. Systems can.
This constant monitoring matters more than it seems. A stock breaks above resistance at 2 AM Eastern time on heavy volume. By the time you check the charts the next morning, the price has already risen 8%, and the risk-reward ratio has deteriorated. AI systems detect the breakout as it happens, evaluate whether volume and momentum characteristics match historical patterns that sustain versus fade, then alert you to high-probability setups while entries still make sense.
The advantage extends beyond capturing overnight moves. Markets shift gradually, then suddenly. Sector rotation begins with subtle changes in relative strength before becoming obvious. Institutional accumulation shows up in volume patterns weeks before price breakouts attract attention. Continuous surveillance identifies these developing conditions early, when positioning still offers favorable risk-reward, rather than after others have noticed.
Accuracy That Compounds Over Time
Training on large historical datasets improves the precision of technical signal-based forecasts, often outperforming traditional rule-based systems that apply the same logic regardless of context. A human analyst might recognize that stocks breaking above 52-week highs on strong volume tend to continue higher. An AI model quantifies that this pattern produces sustained moves 67% of the time overall, but success rates jump to 82% when the breakout occurs during the first hour of trading with volume exceeding 200% of the 30-day average, and sector peers show similar strength.
That statistical precision reduces guesswork. Instead of treating all breakouts equally, you prioritize setups with the highest historical success rates under current conditions. Over hundreds of trades, those incremental probability improvements compound into meaningful performance differences. A system that identifies high-probability setups 5% more accurately than manual analysis generates substantially better outcomes across a full year of trading.
The learning mechanism creates a feedback loop that traditional analysis lacks. AI models track which signals led to profitable outcomes versus losses, adjusting their factor weights based on actual results rather than theoretical assumptions. If certain candlestick patterns that textbooks describe as bullish actually produce mediocre results in current market conditions, the system learns to discount them. This empirical refinement beats relying on patterns that worked in different eras but haven't adapted to modern market structure.
But knowing AI's advantages only matters if you understand how to integrate these capabilities with other trading approaches without creating conflicts that undermine both.
Related Reading
- What is Automated Trading
- What is Backtesting in Trading
- How To Use the Fib Retracement Tool
- Do Hedge Funds Use Technical Analysis
- What is SMA in Stocks
- Fundamental Analysis vs Technical Analysis
- How to Do Technical Analysis of Stocks
- How to Read Stocks
- Bar Chart vs Candlestick
- Day Trading Patterns
- Moving Average Crossover Strategy
- How to Analyze a Stock Before Investing
- Volume Technical Analysis
- Double Top Chart Pattern
- Quantitative Stock Analysis
Can AI Stock Technical Analysis Be Combined With Other Trading Strategies?

Many investors cling to isolated trading methods, believing that sticking to one approach, like pure technical charts or fundamental reviews, guarantees success, yet volatile markets often expose their limitations, leading to missed opportunities and higher risks. A 2023 study from the Stanford Graduate School of Business found that traditional fund managers generated only $2.8 million in quarterly alpha over 30 years, underscoring how human-only strategies can underperform in complex environments.
But here's the exciting shift: blending AI-powered technical analysis with diverse strategies creates hybrid systems that adapt dynamically, boosting returns significantly—as seen when the same study showed an AI-enhanced approach adding $17.1 million per quarter, outperforming 93% of managers by an average of 600%. This fusion not only challenges outdated norms but also allows traders with smarter, more resilient tools, sparking enthusiasm for exploring how these combinations unlock new levels of market edge.
Pairing Technical Signals With Business Fundamentals
Technical patterns tell you what's happening to price. Fundamentals explain why it matters. A stock breaking above resistance on strong volume looks compelling until you check the balance sheet and discover deteriorating margins, rising debt levels, and guidance cuts buried in the latest 10-Q. AI systems excel at flagging these technical setups across thousands of securities, but they can't always distinguish between breakouts backed by genuine business improvement versus those driven by short-term speculation.
The combination works because each approach filters the other's noise. Fundamental screens identify companies with strong earnings growth, reasonable valuations, and competitive advantages. AI technical analysis then monitors these fundamentally sound candidates for optimal entry points when price action confirms accumulation. You're not chasing every technical setup that appears. You're waiting for high-probability entries on businesses that deserve your capital.
According to research from LiquidityFinder, AI now accounts for 89% of global trading volume, yet the most successful implementations still incorporate human judgment on business quality and competitive positioning. Algorithms detect when institutional money flows into a stock. Experienced analysts determine whether that accumulation reflects smart money recognizing value or late-cycle momentum chasing. Both perspectives matter.
Integrating Market Sentiment Analysis
Price patterns reveal trader behavior. Sentiment data explains the emotions driving that behavior. When AI identifies a bullish technical setup but social media sentiment shows extreme euphoria, that divergence signals caution. Conversely, strong technical foundations combined with pessimistic sentiment often precede sustained moves as skeptics capitulate.
Sentiment integration extends beyond social platforms. Earnings call transcripts, analyst revisions, options positioning, and news flow all contain signals about market psychology. Machine learning models parse this unstructured data at scale, quantifying sentiment shifts that would take days to assess manually. When sentiment metrics align with technical patterns, conviction increases. When they diverge, risk management tightens.
The challenge surfaces when sentiment becomes the primary driver during speculative episodes. Meme stock rallies demonstrate how social sentiment can overwhelm technical and fundamental logic for extended periods. Hybrid systems that weight sentiment appropriately, treating it as confirmation rather than a primary signal, navigate these environments better than approaches that ignore crowd psychology entirely or let it dominate decision frameworks.
Building Multi-Timeframe Strategy Layers
Different trading horizons require different analytical approaches. Day traders need rapid pattern recognition across minute-level charts. Position traders focus on weekly and monthly trends. Long-term investors care about multi-year business trajectories. AI technical analysis adapts across these timeframes, but the supporting strategies should shift accordingly.
Short-term systems benefit from combining momentum indicators with volume profile analysis and order flow data. AI detects when prices break above key levels while institutional buying accelerates, signaling potential continuation. These setups last for hours or days, requiring rapid execution and strict risk management. The technical edge matters more than fundamental depth when holding periods are measured in sessions rather than quarters.
Longer timeframes gain more from blending technical entries with fundamental conviction and macroeconomic context. A stock might show a perfect technical setup for a swing trade, but if the broader sector faces regulatory headwinds or economic conditions favor defensive positioning, that context overrides the chart pattern. Most traders struggle with this integration because markets generate thousands of technical signals daily, while fundamental and macroeconomic analysis updates more slowly.
Platforms like MarketDash address this by filtering AI-detected patterns through expert curation that considers business quality, sector dynamics, and market conditions, delivering setups that meet both technical and fundamental criteria rather than forcing traders to reconcile conflicting signals themselves.
Reinforcement Learning for Strategy Optimization
Testing strategy combinations manually takes years. You try blending moving averages with RSI, track results, adjust parameters, repeat. Reinforcement learning compresses this process into weeks by simulating thousands of strategy variations on historical data and identifying which combinations deliver the best risk-adjusted returns across different market regimes.
The system learns that certain technical rules perform better in trending markets, while others excel in range-bound conditions. It finds that momentum strategies outperform when volatility is below specific thresholds, but mean-reversion approaches dominate when volatility spikes. These insights emerge from data rather than assumptions, creating adaptive frameworks that shift strategy weights as conditions change.
This optimization extends to position sizing and risk management. The model tests how different combinations of technical signals, fundamental screens, and sentiment filters perform with various allocation schemes. It learns that high-conviction setups, where all factors align, justify larger positions, while mixed signals warrant smaller exposure. Over time, the system develops a probability-weighted approach to capital allocation that traditional rule-based strategies can't match.
Factor Investing Enhanced by Technical Timing
Factor strategies (value, momentum, quality, low volatility) have driven institutional returns for decades. The problem lies in implementation. Buying value stocks when they're cheap sounds simple until you realize they often get cheaper before recovering. Momentum works until it doesn't, typically during sharp reversals that erase months of gains.
AI technical analysis improves factor strategy execution by timing entries and exits more precisely. A value screen identifies underpriced stocks based on fundamental metrics. Technical systems then monitor these candidates for signs of accumulation (rising volume on up days, support holding at key levels, relative strength improving versus sector peers). You're still buying value, but you're entering when price action suggests other investors are recognizing that value rather than catching falling knives.
Momentum strategies benefit similarly. Instead of mechanically buying the strongest performers and hoping trends continue, AI monitors technical health indicators that signal when momentum remains sustainable versus when it's exhausting. Divergences between price and volume, weakening breadth, or distribution patterns suggest exits before momentum crashes become obvious. The factor provides the universe of candidates. Technical analysis refines when to act on them.
Multi-Agent Systems for Collaborative Analysis
Breaking analysis into specialized components creates more robust decision frameworks than monolithic systems that try to do everything at once. One AI agent focuses on pattern recognition across price charts. Another monitors volume characteristics and order flow. A third tracks sector rotation and relative strength. A fourth assesses risk metrics and correlation structures.
These agents operate independently but share findings, creating a collaborative intelligence that mirrors how professional trading desks function. The pattern recognition agent flags a bullish setup. The volume agent confirms accumulation. The sector agent notes that the stock's industry group is outperforming the broader market. The risk agent verifies that position sizing fits within portfolio parameters. When all agents align, conviction increases. When they conflict, the system either passes on the opportunity or reduces position size to reflect uncertainty.
This architecture handles complexity better than trying to build one model that does everything. Each agent optimizes for its specific domain, developing specialized expertise that general-purpose systems can't match. The integration layer then synthesizes these perspectives into actionable recommendations, much like experienced portfolio managers weigh input from technical analysts, fundamental researchers, and risk managers before making final decisions.
Addressing the Integration Challenges
Combining multiple strategies sounds appealing until you encounter practical challenges. Different approaches generate conflicting signals. Technical indicators signal a flash buy, while fundamental metrics suggest overvaluation. Sentiment turns bullish, but price action shows distribution. How do you resolve these contradictions without creating analysis paralysis?
The solution lies in hierarchy and context. Establish which factors matter most for your specific objectives and timeframes, then use other signals as confirmation or filters rather than equal votes. A long-term investor might weight fundamentals most heavily, using technical analysis to time entries into fundamentally attractive positions. A swing trader might prioritize technical setups and use fundamental screens to avoid companies with hidden risks that could derail trades.
Transparency also matters. Black-box systems that combine multiple strategies without explaining their logic undermine trust. When a hybrid model recommends a trade, you should understand which factors drove that decision and how confident the system is based on signal alignment. This visibility allows you to override recommendations when you have information or context the model lacks, maintaining human judgment in the loop rather than blindly following algorithmic output.
But understanding how to combine strategies only prepares you for the next question: which specific tools actually deliver these capabilities in practice?
7 Best AI Stock Technical Analysis Tools in 2026

The landscape of AI-powered technical analysis platforms has matured beyond simple chart scanning into sophisticated systems that combine pattern recognition, predictive scoring, and multi-factor evaluation. The strongest tools in 2026 don't just automate traditional indicators.
They synthesize technical signals with fundamental data, sentiment analysis, and institutional tracking to surface opportunities that meet multiple confirmation criteria simultaneously. Below are seven platforms that excel across a range of investor needs, from automated trading execution to curated research delivery.
1. MarketDash
MarketDash delivers a robust platform that enhances stock evaluation with artificial intelligence, delivering expert-level breakdowns and recommendations for investors. It combines AI-driven examinations with curated selections to support decisions across multiple timeframes, incorporating technical assessments into its ranking systems to identify promising opportunities.
While emphasizing fundamental strengths, the tool integrates technical factors alongside market dynamics to generate reports and picks that help users spot potential gains in volatile environments. This makes it a valuable resource for those seeking automated intelligence to refine their equity market strategies.
Key Features
- AI SWOT evaluations that pinpoint strengths, weaknesses, opportunities, and threats for individual equities using machine learning.
- Proprietary MarketDash AI technology generates in-depth insights for stock recommendations and strategies.
- Fundamental metrics analysis providing core financial data integrated with AI for comprehensive reviews.
- Dedicated fundamental reports offering detailed breakdowns enhanced by algorithmic processing.
- Trading strategy documents that incorporate technical elements to guide short-term moves.
- The mid-to-long-term strategy outlines how to leverage AI to drive sustained growth.
- Dividend-focused strategies using intelligent algorithms to highlight income-generating options.
- Insider transaction monitoring powered by data aggregation for timely alerts.
- Hedge fund activity tracking with AI to reveal institutional trends affecting stock performance.
- Top stock rankings are derived from a blend of technical indicators, fundamentals, and positioning.
Pros
- Delivers expert AI-generated insights quickly, saving time on manual research.
- Combines multiple report types for versatile analysis across different investment horizons.
- Focuses on curated selections that blend human oversight with machine learning to ensure reliability.
- Includes technical considerations in rankings to support well-rounded decisions.
- Weekly updates on opportunities keep users informed of emerging trends.
Best Use Cases
- Identifying short- to medium-term trading chances through AI-enhanced weekly picks.
- Building long-term portfolios with strategies rooted in technical and fundamental data.
- Monitoring institutional moves, such as hedge funds, to anticipate market shifts.
- Generating dividend income streams via specialized AI reports.
- Conducting SWOT reviews for quick equity assessments before trades.
Best For
- Active investors who want AI-assisted insights without complex charting tools.
- Beginners seeking guided recommendations that blend technical and fundamental perspectives.
- Long-term holders focused on growth and stability through curated strategies.
- Users track insider and hedge fund data for an edge in analysis.
- Those who prefer report-based tools to real-time scanning for decision-making.
2. Zen Ratings
Zen Ratings employs a sophisticated grading mechanism that evaluates equities on a letter-based scale based on multiple indicators linked to market outperformance. This approach has delivered an impressive average annual return of 32.52% on its highest-rated selections since 2003. Its thorough examination covers 115 distinct elements and includes a specialized AI module that equips machine learning to identify promising investments. By blending essential factors such as revenue streams, financial health, valuation shifts, and broader economic trends, it provides concise, actionable guidance. While a no-cost option is available, upgrading to a paid tier unlocks deeper research capabilities.
Key Features
- Comprehensive stock grading based on 115 factors, including AI-driven insights for superior market predictions.
- Access to current lists of top-rated equities for informed portfolio building.
- Machine learning-powered scores are assigned to each stock to highlight growth potential.
- Analyst projections and suggestions from high-achieving experts.
- Brief summaries explaining recent price fluctuations.
- Timely notifications via email for monitored investments.
- Additional services like managed portfolios and strategy-based selections for hands-off investing.
3. Seeking Alpha Premium
Seeking Alpha Premium delivers in-depth market evaluations and equity suggestions through its AI-enhanced Virtual Analyst Reports. These tools apply intelligent algorithms to review historical and current financial records, earnings announcements, and expert opinions, assigning rankings to guide smarter investment decisions. They assist in sifting through information to align with personal financial objectives and use artificial intelligence to anticipate potential changes in value. This service stands out for its blend of automated data processing with professional content, making complex analysis more accessible.
Key Features
- Unlimited entry to specialized investment resources and evaluations.
- Expert articles and opinions from seasoned financial professionals.
- AI-generated reports that simulate analyst reviews for quick insights.
- Equity classifications derived from key economic measures.
- Proprietary studies and exclusive market intelligence.
- Tools for customizing searches and alerts based on user preferences.
- Integration with community discussions for broader perspectives.
4. Trade Ideas
Trade Ideas is a dynamic AI platform for equity analysis that uses machine learning to generate reliable investment recommendations and trading signals in real time. Beyond automated assessments, it supports direct order placement from visual displays by connecting to brokerage accounts, enabling swift action on opportunities. Its flagship AI, Holly, runs nightly simulations across thousands of assets to identify optimal choices for the next session. This system continuously updates its forecasts by monitoring live data, making it ideal for those handling frequent transactions. It also recommends appropriate risk controls, such as exit points, to help capture brief market movements.
Key Features
- Dedicated AI helper for ongoing market monitoring.
- Scans before and after standard hours to spot extended opportunities.
- Intelligent filtering to identify assets meeting specific criteria.
- Instant notifications for emerging trade setups.
- Practice mode for simulating strategies without financial risk.
- Tailorable parameters to align with individual approaches.
- Automated execution options for efficient operations.
5. TrendSpider
TrendSpider is an automated equity review and transaction automation system that integrates technical metrics with AI to formulate and execute investment plans. It streamlines chart-based evaluations by automatically generating visuals and detecting patterns to aid in asset selection. Included are simulation capabilities for strategy validation and robotic trading for hands-free operations. Its algorithms proactively analyze markets, identify key levels on graphs, and provide visual aids, such as thermal representations, to improve forecasting. Users can personalize the AI to uncover trends tailored to their methods, with multi-period views that provide layered insights across varying holding durations.
Key Features
- AI support for immediate responses to strategy queries.
- Personalized notifications triggered by market behaviors.
- Historical testing for refining technical plans.
- Visual mappings and automatic pattern identification.
- User-defined model development through simple inputs.
- Cross-period examinations for comprehensive views.
- Robotic systems for independent trade handling.
6. Tickeron
Tickeron operates as an AI-focused marketplace for automated trading solutions and analytical instruments in the equity space. Basic access provides routine purchase and disposal recommendations, with the option to incorporate robotic traders, search mechanisms, pattern detectors, screening devices, and live evaluations for an additional charge. It excels in robotic operations, allowing the setup of automated routines that handle buys, sells, protective stops, and profit targets. For deeper insights, it includes AI-based chart recognition, future estimates, and signal-based filtering for each asset. Though pricier, with add-ons that can exceed $100 per month, it's suitable for those seeking AI-powered automation.
Key Features
- Routine AI-generated buy and sell indicators.
- Selectable automated traders for specific tactics.
- Enhanced pattern identification capabilities.
- Predictive trend assessments via AI.
- Screening tools with integrated signals.
- Model-based collections for extended holdings.
- Active management options for dynamic participants.
7. Danelfin
Danelfin stands out as an AI-driven equity research solution that delivers daily updates on high-potential investments, complete with predictive rankings and forward-looking price targets. Its proprietary scoring system evaluates U.S. and European equities, as well as various ETFs, assigning values from 1 to 10 that reflect the estimated likelihood of exceeding market benchmarks over the next three months. By processing thousands of daily indicators across technical, fundamental, and sentiment categories, the AI generates transparent insights and actionable trade concepts, including multiple target levels and directional cues for short- to medium-term positions.
Key Features
- AI-generated probability-based scores (1-10) indicating market-beating potential over three months.
- Curated lists of top-performing stocks and ETFs are refreshed on a rolling basis.
- Detailed trade suggestions featuring various price objectives and entry/exit signals.
- Coverage extending to the U.S., major European markets, and exchange-traded funds.
- Historical backtested results show consistent outperformance versus major benchmarks.
- Portfolio optimization features like average score tracking and diversity metrics.
- Downloadable datasets for custom analysis of past AI predictions and outcomes.
But having access to sophisticated tools matters only if you know how to evaluate which platform best fits your trading approach and experience level.
Related Reading
- AI Quantitative Trading
- AI Swing Trading
- Stock Sentiment Analysis
- Penny Stock Analysis
- Volume Analysis Trading
- How to Find Stocks to Day Trade
- How to Scan Stocks for Swing Trading
- Best Stock Trading Strategies
- Best Indicators for Day Trading
- Technical Analysis Trading Strategies
- Best Stock Indicators for Swing Trading
- Trading Exit Strategies
How to Choose the Best AI Stock Technical Analysis Tools

Selecting the right platform depends on matching technical capabilities to your specific trading style, timeframe, and experience level. Start by identifying whether you need real-time scanning for day trades, pattern recognition for swing positions, or comprehensive analysis for longer-term holdings. Then evaluate tools based on accuracy verification methods, data quality, interface usability, and customization depth rather than marketing promises about AI sophistication.
Match Capabilities to Your Trading Timeframe
Day traders require different functionality than position traders. If you're executing trades that last minutes to hours, prioritize platforms with real-time scanning, low-latency data feeds, and direct brokerage integration. Speed determines whether you capture momentum shifts before they reverse. Tools that refresh every fifteen minutes won't help when opportunities appear and disappear within five-minute windows.
Swing traders holding positions for days or weeks benefit more from pattern recognition systems that identify multi-day formations like flags, triangles, or cup-and-handle setups. These timeframes enable deeper analysis by combining technical signals with fundamental context. You're not racing against milliseconds. You're waiting for confluence across multiple indicators before committing capital.
Long-term investors need platforms that monitor technical health across entire portfolios without requiring constant attention. Automated alerts when positions break below support levels or develop concerning patterns matter more than intraday price action. The system should handle surveillance while you focus on business quality and competitive positioning.
Verify Accuracy Through Backtesting Transparency
According to the SchemaForge AI Blog, 12 AI-powered stock research platforms were available for technical analysis in 2025, but performance claims vary widely without standardized verification. Demand platforms that show historical accuracy across different market conditions, not just cherry-picked winning periods. A system that performed brilliantly during the 2023 rally but failed during 2022's volatility hasn't proven reliability.
Look for tools that break down performance by market regime. How did pattern recognition perform during trending markets versus choppy sideways action? What was the false signal rate when volatility spiked above historical averages? Systems trained exclusively on bull-market data often generate excessive buy signals regardless of market conditions, leading to losses when market character shifts.
Downloadable prediction histories let you verify claims independently. Import past signals into your own analysis to check whether the system actually identified patterns before breakouts or flagged them after moves were obvious. This verification step separates platforms with genuine predictive power from those that excel at explaining what already happened.
Assess Data Quality and Coverage Breadth
Technical analysis accuracy depends entirely on data integrity. Platforms that source feeds from unreliable providers generate false signals due to bad ticks, delayed updates, or incomplete volume information. Verify that tools use institutional-grade data with minimal latency and comprehensive coverage across the securities you trade.
Coverage matters beyond just having data. Does the platform track pre-market and after-hours activity where significant moves often occur? Can it monitor international markets if you trade globally? Does it include alternative data, such as options flow, institutional positioning, or sentiment metrics, that provide context beyond price and volume?
Real-time versus delayed data makes a substantial difference for active strategies. A fifteen-minute delay may seem minor until you realize that breakouts are identified after optimal entries have passed. For longer-term approaches, end-of-day data is sufficient and less costly. Match data refresh rates to your actual execution needs rather than paying for capabilities you won't use.
Evaluate Interface Design and Learning Curve
Sophisticated algorithms matter little if you can't navigate the interface efficiently. Test platforms during free trials by performing your typical workflow. How many clicks does it take to scan for specific patterns? Can you customize layouts to prioritize the information you check most frequently? Do charts load quickly when switching between securities?
The best systems balance power with accessibility. Beginners need intuitive designs that don't require programming knowledge or extensive training. Advanced users want greater customization to build proprietary scans and alerts. Some platforms offer tiered interfaces, with simple modes handling common tasks while advanced features remain available as needed.
Mobile functionality extends analysis beyond desktop hours. If you monitor positions throughout the day, ensure the platform delivers full functionality on smaller screens rather than stripped-down versions that require a computer for critical functions. Push notifications for custom alerts keep you informed without constant app checking.
Test Customization and Integration Flexibility
Generic one-size-fits-all systems rarely align perfectly with individual strategies. Strong platforms let you adjust parameters, create custom scans, and modify alert thresholds to match your specific approach. If you trade based on particular indicator combinations or unique pattern variations, verify the tool supports that customization rather than forcing you into preset templates.
Integration with existing workflows prevents friction. Does the platform connect to your brokerage for smooth order placement? Can you export data to spreadsheets for additional analysis? Will it sync with the portfolio tracking software you already use? Breaking your process into disconnected tools creates inefficiency and increases the risk of errors.
API access matters for traders building automated strategies. If you want to integrate the platform's pattern recognition with your own risk management rules or position-sizing algorithms, programmatic access is essential. Verify that the APIs provide sufficient functionality and that the rate limits accommodate your trading frequency.
Compare Pricing Against Actual Value Delivered
Most traders face this problem. Platforms with thousands of features are overwhelmed with complexity, while basic tools lack depth for serious analysis. Platforms like MarketDash address this by filtering AI-detected technical patterns through expert curation, delivering setups that meet both quantitative criteria and qualitative assessment. The system handles pattern scanning across markets while experienced analysts provide context about which opportunities deserve attention based on business fundamentals, sector dynamics, and timing considerations.
Subscription costs should reflect tangible benefits, such as time savings or improved decision quality. Calculate whether a platform's monthly fee justifies itself through better entries, fewer false signals, or hours reclaimed from manual chart analysis. A $200 monthly tool that identifies one additional high-probability setup per month easily pays for itself. A $50 service that generates noise and requires hours to filter wastes both wastes time and money.
Free tiers let you test core functionality before committing. Use trial periods to verify the platform actually improves your process rather than adding complexity. Track whether signals generated during trials would have improved your actual trading results. Honest evaluation during testing prevents expensive mistakes from annual subscriptions to tools you'll abandon within months.
Examine Support Quality and Educational Resources
Technical issues arise at the worst moments. Verify that platforms offer responsive support through channels that match your needs. Some traders prefer live chat for immediate problem resolution. Others want detailed documentation for self-service troubleshooting. Email-only support with 48-hour response times creates problems when technical glitches prevent trade execution during volatile sessions.
Educational content helps maximize platform value. Quality providers offer tutorials that explain not only how to use features but also why certain technical approaches work under specific conditions. This knowledge transfer improves your overall trading skills rather than creating a dependence on black-box signals you don't understand.
Community forums provide peer insight beyond official documentation. Experienced users share workflow optimizations, custom scan configurations, and practical tips that formal guides miss. Active communities also signal platform health. Vibrant user bases suggest the tool delivers ongoing value and does not experience high churn from disappointed subscribers.
Consider Scalability as Skills Progress
Your needs today differ from requirements six months forward as experience grows. Beginners might start with preset scans and standard indicators. As pattern recognition improves, you'll want deeper customization and more sophisticated analysis tools. Choose platforms that scale with skill development rather than forcing migration to different systems as capabilities advance.
Some tools offer modular pricing, where basic functionality costs less and optional add-ons unlock advanced features. This structure lets you start affordably, then expand capabilities as specific needs emerge. Others bundle everything at a single price, which is beneficial if you'll eventually use most features but wasteful if core functionality suffices indefinitely.
The right platform feels like it grows with you rather than constraining development or overwhelming you with complexity before you're ready. Test whether interfaces support progressive disclosure, ensuring advanced features remain accessible without cluttering simpler workflows.
But choosing the right tool only matters if you're ready to put it to work on actual opportunities.
Related Reading
- Ninjatrader Vs Tradingview
- Stock Market Technical Indicators
- Tradovate Vs Ninjatrader
- Tradestation Vs Ninjatrader
- Trendspider Vs Tradingview
- Thinkorswim Vs Tradingview
- Tools of Technical Analysis
- Tradestation Vs Thinkorswim
- Tradingview Alternative
- Ninjatrader Vs Thinkorswim
Try our Market Analysis App for Free Today | Trusted by 1,000+ Investors
The tools exist. The patterns are detectable. The question now is whether you'll act on what the data reveals or keep second-guessing entries until opportunities pass. MarketDash delivers curated stock picks filtered through both AI pattern recognition and expert judgment, transforming thousands of technical signals into actionable opportunities across different time horizons. Weekly Opportunities surface short-term setups where technical breakouts align with improving fundamentals.
Top Rankings provide a comprehensive analysis for intermediate positions. Long-Term Wealth strategies identify businesses where technical health confirms sustainable competitive advantages. This segmented approach recognizes that technical analysis serves different goals, not just different traders.
The platform's AI SWOT analysis processes fundamental metrics alongside technical factors, while insider transaction monitoring and hedge fund activity tracking explain why certain patterns develop. When a stock breaks resistance on heavy volume while institutions accumulate and insiders buy, that convergence carries weight that algorithms alone can't provide.
Start your free trial to see how expert curation cuts through data overload. Thousands of investors already use MarketDash to identify undervalued opportunities before they become obvious. The difference between watching markets move and positioning ahead of them often comes down to having the right information at the right moment, filtered through experience that separates signal from noise.
Get Market News Alerts
Real-time alerts on price moves, news, and trading opportunities.
Join 20,000+ investors. No spam, ever.
Featured Articles
View all news
Chips Get Crushed, Oil Spikes on Strait Strike: Midday Market Chaos
Elon’s “Atlantic” Secret (Ad)
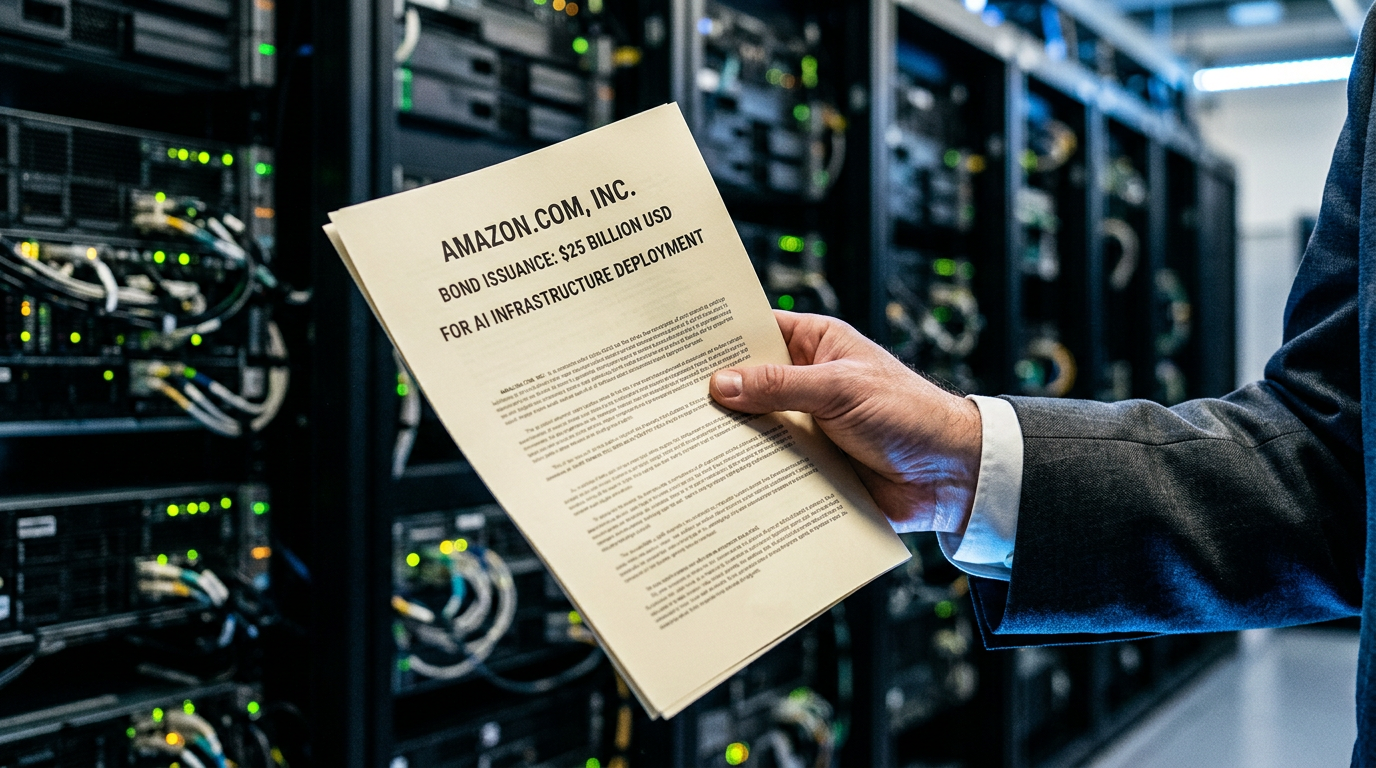
Amazon Is Borrowing $25 Billion to Build AI Stuff. Here's What That Means for the Stock.

Rivian's $1.7 Billion Stock Sale: A Necessary Evil or a Sign of Trouble?

SpaceX Hits the Nasdaq 100 Just 15 Days After Its Debut—But the Stock Is Already Slipping
Strange Elon Crates Spotted Near the Hoover Dam (Ad)

Why Oil Prices Are Rising Even as OPEC+ Adds Supply: It's All About Refineries