Small Caps Are Having Their Best Month in Years. History Says the Real Party Might Just Be Starting.
MarketDash
The Russell 2000 is up over 11% this month, its biggest surge since 2023. Looking back at 13 similar rallies since 1987, the data suggests the biggest gains often come in the year that follows.
Get Market Alerts
Weekly insights + SMS alerts
Just a few weeks after dipping into correction territory, the small-cap benchmark Russell 2000 is staging a comeback that's turning heads. The mood has shifted dramatically, and the numbers are starting to tell a compelling story.
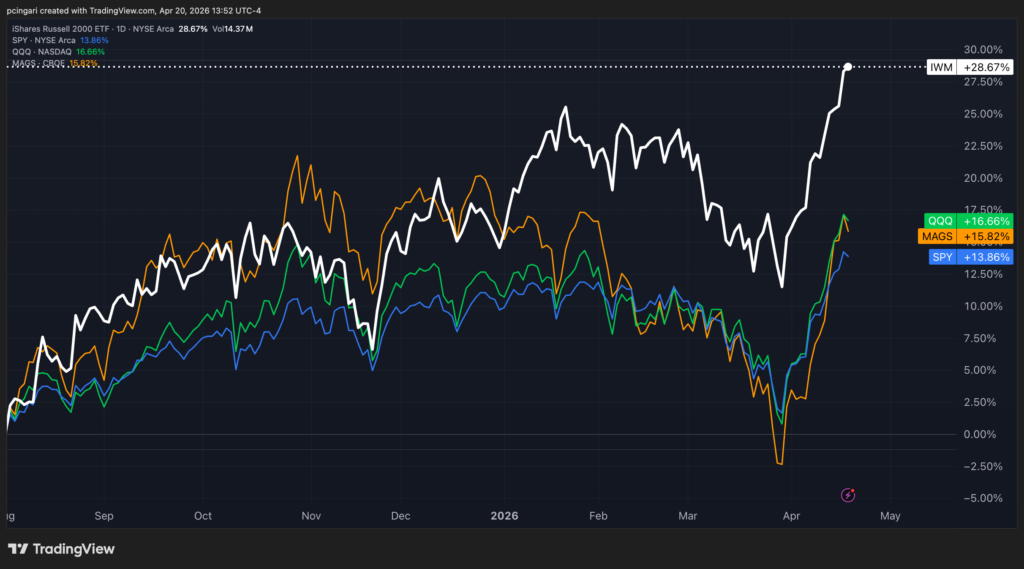
The iShares Russell 2000 ETF (IWM) is up 11.7% month-to-date through April 20. That's its strongest monthly performance since December 2023. Even more impressive, it has closed higher in 12 of the 13 trading sessions so far this month. This snapback rally, fueled by a ceasefire-led drop in oil prices and a recalibration of Federal Reserve rate expectations, has pulled small caps back toward their record highs.
But here's the more interesting question: what typically happens next? When small caps explode higher like this in a single month, is it a signal to buy or a sign of an impending peak?
'The Giant Killer Is Back'
John Roque, head of technical research at 22V Research, has been championing the small-cap bull case since last summer. In his latest chart packet, aptly titled "The Giant Killer," he drew a colorful comparison between the Russell 2000 and Danny Padilla—the 5'2", 170-pound bodybuilder who famously beat Arnold Schwarzenegger at the 1975 IFBB Mr. USA contest.
That framing, which held up through the March selloff, now looks pretty prescient. The technical picture backs it up. Roque's April 20 update shows the Russell 2000 cash index at 2,775, having broken out from a multi-year base around 2,000. His price target is 3,200, which would mean another 15% gain from here.
Chart: Small Caps Have Outperformed Tech-Heavy Benchmarks Since August 2025
The Russell 2000 Signal: 13 Episodes Since 1987
Since the iShares Russell 2000 ETF launched in 1987, monthly rallies of 10% or more have happened exactly 13 times before this current one. This sample covers just about everything: recessions, recoveries, bubbles, and crises—from the 2003 dot-com bottom to the 2020 Covid low to the 2024 post-election surge.
The historical pattern is revealing. If you bought immediately after one of these big monthly surges, the average return over the next month was just 1.71%, with a win rate barely above a coin flip at 53.85%. Chasing the initial momentum rarely pays off quickly.
But patience changes the story. At three months out, the hit rate climbs to 69% and the average return more than triples to 6.72%. The real action tends to come later. Looking out 12 months, the average return jumps to 17.6%, the median to 10.09%, and the Sharpe ratio—a measure of return per unit of risk—reaches a solid 0.80.
Date
Context
IWM Move %
Forward return (%) 1M
Forward return (%) 3M
Forward return (%) 6M
Forward return (%) 12M
Apr 2003
Dot-com bottom
+10.28
+10.87
+19.24
+32.87
+39.94
Apr 2009
GFC low
+15.39
+3.40
+14.53
+16.10
+47.67
Sep 2010
QE2 anticipation
+12.16
+4.15
+15.91
+24.70
−4.74
Oct 2011
Euro crisis bounce
+15.10
−0.35
+6.77
+2.84
+10.90
Nov 2016
Trump 1.0 victory
+11.06
+2.46
+4.73
+3.58
+16.75
Jan 2019
Powell pivot
+11.32
+2.70
−2.15
−0.15
+7.69
Apr 2020
Covid trough
+13.85
+6.59
+13.08
+17.48
+72.58
Nov 2020
Vaccine news
+18.24
+13.56
+22.05
+24.57
+22.89
Jul 2022
Bear rally
+10.56
−2.00
−2.09
+2.26
+6.12
Oct 2022
Pre-CPI relief
+11.16
−4.89
+4.45
−4.43
−2.00
Dec 2023
Fed pivot rally
+11.72
−3.90
+4.78
+1.09
+10.09
Jul 2024
Rotation trade
+10.34
−1.69
−2.72
+1.17
−2.00
Nov 2024
Trump 2.0 victory
+11.07
−8.65
−11.25
−15.21
+2.84
Apr 2026
Hormuz recovery
+11.54 (Through April 20)
—
—
—
—
Average
—
+1.71
+6.72
+8.22
+17.60
Median
—
+2.46
+4.78
+2.84
+10.09
Win rate
—
53.85%
69.23%
76.92%
76.92%
Sharpe
—
0.28
0.71
0.62
0.80
Max drawdown
—
−8.65
−11.25
−19.44
−19.44
Source: TradingView event study. N=13 prior episodes of IWM monthly returns ≥10% since 1987 inception. Current April 2026 signal shown for reference.
The Best Cases: Cycle Bottoms
Let's look at the home runs. The most spectacular forward returns followed these major market lows:
April 2020 — Covid Trough. The Russell 2000 surged 13.85% as the Fed unleashed unlimited quantitative easing and slashed interest rates to zero. Twelve months later, the ETF was up a staggering 72.58%—the single best outcome in the entire dataset.
April 2009 — GFC Low. Small caps jumped 15.39% as credit markets began to thaw and bank stress-test results helped remove tail risk. The following year delivered a 47.67% gain.
April 2003 — Dot-Com Bottom. A 10.28% monthly gain arrived as the market absorbed the Iraq invasion and started pricing in the end of the tech bust. The twelve-month forward return was 39.94%.
In each of these cases, the explosive monthly rally was a starting pistol for a much longer, powerful uptrend.
The Worst Cases: Mid-Cycle And Late-Cycle Traps
Now for the cautionary tales. Not every 10%+ month leads to glory. Some turned out to be head fakes:
November 2024: Post-Election Euphoria. The Russell 2000 popped 11.07% on the Donald Trump election-victory trade, as investors priced in hopes of deregulation and tax cuts. What followed was an 8.65% drop in the next month, a 15.21% fall over six months, and only a modest 2.84% gain over the full 12 months.
October 2022: Bear Market Rally. An 11.16% surge gave way to a 2% decline over the next 12 months as the Fed kept aggressively hiking rates into a slowing economy.
September 2010: QE2 Anticipation. A 12.16% rally on hopes of Fed easing preceded a 4.74% loss a year later as the Eurozone debt crisis worsened.
Notice a pattern? The weaker outcomes tend to cluster around rallies driven by policy speculation rather than policy confirmation. When the hoped-for catalyst doesn't materialize as expected, the gains can quickly unravel.
Where April 2026 Fits In Russell 2000 History
So, which camp does the current rally fall into? It has one foot in each.
Like the best historical cases, it was preceded by a meaningful correction. The Russell 2000 fell 10.9% from its January peak before this rebound began, providing a reset in sentiment and valuation.
But like some of the weaker historical cases, monetary policy remains uncertain. Expectations for interest-rate cuts have shifted significantly since the start of the conflict in Iran. Before the war, traders had priced in at least two rate cuts for 2026. Now, according to prediction platform Polymarket, the leading outcome is zero cuts (at 35% probability), with one cut at 31%. That's a material change in the backdrop.
What It Means For Investors
The takeaway from nearly four decades of data is specific. Buying the Russell 2000 right after a 10%+ month gives you roughly a coin-flip chance of making money over the next four weeks. The immediate edge isn't great.
The real payoff tends to compound in the second half of the year. That's when the win rate hits 77% and the average return reaches double digits. The signal isn't really about the first month; it's about the trajectory it might set for the next eleven.
The critical differentiator is context. A 10% monthly surge emerging from a deep correction, with actual policy easing on the horizon, has been one of the most reliable setups for small-cap investors. A 10% surge built on speculation, with policy still up in the air, has often been a trap.
April 2026 is currently sitting right on the line between those two histories. Whether this rally rhymes with the glorious rebounds of 2009 and 2020 or the frustrating fades of 2022 and 2024 will likely be decided by the next Fed meeting, the next inflation report, and the evolving situation in the Strait of Hormuz. The first big move has happened. The next chapters are still being written.