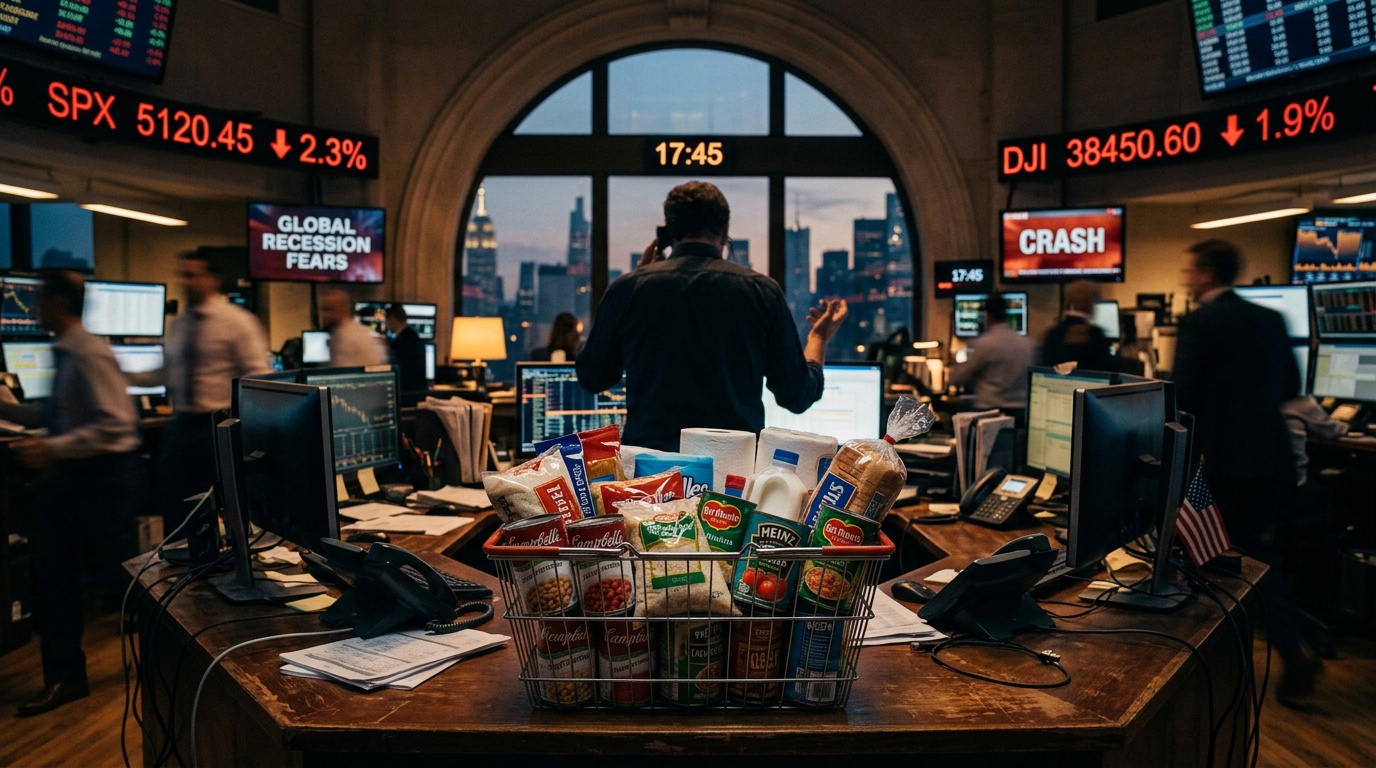
So, Wall Street just tripped over a technical line in the sand. You know the one—the 200-day moving average. It's that long-term trend line traders watch like hawks, and on Thursday morning, all three major U.S. stock indices—the S&P 500, the Nasdaq 100, and the Dow Jones Industrial Average—slipped below it. Together. That doesn't happen every day.
The last time we saw this kind of group breakdown was back in early 2025, when the market got spooked by fears of sweeping new tariffs. This time, the trigger seems to be an oil crisis tied to shipping disruptions in the Strait of Hormuz. As of 10:00 a.m. ET Thursday, the numbers told the story: the S&P 500 traded at 6,589 (below its 200-day average of 6,618.97), the Nasdaq 100 stood at 24,260.91 (versus 24,347.52), and the Dow fell to 45,980 (against 46,547.36).
Now, if you're a chart-watcher, this is supposed to be a big, flashing red light. The 200-day moving average is basically the average closing price over the last 200 trading sessions—roughly a year of market action. When price dips below it, the classic interpretation is that the bullish trend has officially shifted to bearish. But here's the funny thing about markets: they love to make rules just to break them. And a decade of data tells a story that's surprisingly... optimistic. With one very important catch.
Dow Jones: The Bumpy Road to Gains
Let's start with the blue chips. Over the last 10 years, the SPDR Dow Jones Industrial Average ETF Trust (DIA) has broken below its 200-day moving average 20 times. If you look at the aggregate results, the short term can be rocky, but the longer-term picture tilts decisively positive.
One month after a breakdown, the average return is +0.60%, with a win rate of 63.16%. But that "average" hides a wild range: the best one-month gain was +7.82%, while the worst was a gut-wrenching -21.66%. So, the first month is a coin flip with big swings.
But give it time. Three months out, the average return jumps to +3.23% with a 73.68% win rate. At six months, it's +5.81% (73.68% win rate). And one year later? The average gain is +11.20%, with a stellar 82.35% of breakdowns resolving higher. The median one-year return is +9.54%, and the average maximum drawdown investors had to endure was -15.31%.
Looking at the five most recent episodes drives the point home. Of those five, four produced positive returns at the three-month and six-month marks. The sole exception—September 2023—still saw a strong recovery after a negative first month, posting an +11.70% gain at three months and +25.47% at one year.
Nasdaq 100: A Volatile Start, a Powerful Finish
The tech-heavy Invesco QQQ Trust (QQQ), which tracks the Nasdaq 100, has seen 14 such breakdowns in the past decade. Its near-term profile is a bit more cautious than the Dow's. The average one-month return is actually slightly negative at -0.27%, dragged down by a couple of brutal outliers from the 2022 rate-hike bear market.
But once again, patience is rewarded. Three months after a breakdown, the average return turns positive at +4.51%. At six months, it leaps to +12.56% with an 84.62% win rate. And one year out? The numbers are eye-popping: an average return of +25.29%, a median return of +26.19%, and that same 84.62% win rate. The catch? The average max drawdown was -16.24%.
The recent history for QQQ is a tale of two markets. The 2022 episodes were brutal, with breakdowns in January and March leading to double-digit losses across all time horizons. But the 2023 breakdowns produced some of the strongest recoveries on record. The March 2023 event, for instance, generated a +53.75% return over the following year. Even the March 2025 breakdown—triggered by tariff anxiety—saw a painful -13.42% first month before recovering to post an +18.00% gain at six months.
S&P 500: The Most Consistent Recoverer
The broad market, represented by the SPDR S&P 500 ETF Trust (SPY), offers perhaps the most consistently positive historical profile. It's posted positive average and median returns across all four measured time horizons following a 200-day breakdown.
One month out, the average return is +0.45% with a 60.00% win rate. At three months, it's +3.52% (73.33% win rate). Six months later, the average gain is +9.81% with a remarkably high win rate of 86.67%. One year after a breakdown, the average return is +15.95% with an 80.00% win rate. The median one-year return is +13.81%, and the average max drawdown was -16.52%.
Of the three indices, SPY's six-month win rate is the highest. The data suggests the S&P 500 has historically used these 200-day breakdowns more as launching pads for recoveries than as the start of prolonged bear markets.
Looking at the last five events, four delivered positive six-month and one-year returns. The most relevant comparison to today might be March 10, 2025—the last simultaneous three-index breakdown. Back then, SPY lost 11.43% in the first month but then recovered 16.01% over the next six months and 20.65% over the full year.
The Non-Negotiable Caveat
So, the 10-year data has a clear message: on a 12-month horizon, the odds are historically in the bulls' favor. But you can't just glance at the win rates and average returns. You have to read the fine print—the drawdowns.
The average maximum drawdown after these events is significant: about -16.52% for SPY, -16.24% for QQQ, and -15.31% for DIA. The recovery is rarely a straight line up. Investors who bought immediately after the March 2025 breakdown had to sit through another 11.43% loss in SPY and another 13.42% drop in QQQ before the rebound began.
The historical win rates are compelling. But collecting on that bet requires the stomach to sit through the drawdown first. It's the market's version of "no pain, no gain." The signal might be flashing red, but history suggests it often turns green for those who can wait it out.