


If you were hoping Friday's market bounce signaled the all-clear, Jim Cramer has some bad news: you're delusional. The CNBC host minced no words about traders clinging to Federal Reserve optimism as Bitcoin (BTC) crashed to $81,000, triggering one of the year's most violent liquidation cascades.
Cramer Dismisses Market Rally as Bitcoin Suffers $1.16 Billion Liquidation Cascade
MarketDash
CNBC's Jim Cramer called Friday's market bounce delusional as Bitcoin crashed to $81,000 amid one of the year's most brutal liquidation waves, with analysts warning of deeper losses ahead
Get Market Alerts
Weekly insights + SMS alerts
Fed Optimism Won't Fix This Mess
Cramer argued that market participants misread the situation after Federal Reserve board member John Williams made recent comments. According to him, nothing meaningful actually changed, and plenty of traders "need to get out" before conditions worsen.
The latest bounce attempt made "no sense," he said, emphasizing that no one can simply "wave a magic wand" to repair the underlying damage. He pointed to persistent problems around data-center buildouts and structural vulnerabilities embedded in various trading strategies.
The selloff accelerated after the United States released a disappointing October jobs report, which sparked rapid unwinding across risk assets. What looked like a recovery moment turned into another leg down.
Bitcoin's Billion-Dollar Liquidation Nightmare
The numbers tell a brutal story. Over a 24-hour period, the crypto market experienced $2.24 billion in total liquidations, with Bitcoin alone accounting for $1.16 billion according to Coinglass data. This represents one of the heaviest forced-selling clusters of the entire year.
When prices drop this fast, leveraged positions get wiped out automatically, creating a feedback loop of selling that pushes prices even lower. That's exactly what happened as Bitcoin breached critical support levels and cascaded into the low $80,000s without any meaningful buying pressure to slow the descent.
Bloomberg analyst Mike McGlone raised eyebrows with a stark warning: Bitcoin's current chart structure resembles its 2018 breakdown, when the cryptocurrency unwound sharply after losing long-term support. He said the setup "looks similar to the last major unwind" and suggested prices could potentially fall as low as $10,000 if momentum fully breaks. That's the kind of call that makes even seasoned crypto veterans uncomfortable.
Crypto Cheerleaders in the Crosshairs
Cramer also took aim at what he called "consistent bullish crypto cheerleaders" who continue promoting ambitious long-term price targets like $1 million per Bitcoin. While he didn't name names directly, the comments appeared to reference Ark Invest CEO Cathie Wood, who has long maintained that Bitcoin's fixed supply and growing institutional adoption could drive it to seven figures by 2030.
It's a debate that cuts to the heart of crypto investing: are these visionaries seeing what others miss, or are they dangerously detached from market reality? Right now, with Bitcoin down hard and momentum firmly negative, the skeptics are having their moment.
The Technical Picture Looks Grim
Bitcoin has entered a clear corrective phase after losing the rising trendline that supported the entire 2023-2025 rally. That's not a minor technical hiccup—it's a structural shift. The weekly candle closed well below that trendline, and sellers drove prices straight into the low $80,000s without facing meaningful resistance.
The weekly RSI sits near 34, showing weakness but leaving room for additional downside before reaching oversold territory. Meanwhile, the MACD indicator has rolled over hard, confirming that bearish momentum now controls the higher timeframe. These aren't the kind of signals that attract aggressive buyers.
Where Does Bitcoin Go From Here?
If the selling pressure continues, the next major support zone sits between $70,000 and $75,000. This region served as a significant demand area in previous cycles and represents a strong-low zone that could potentially halt the decline. But getting there would mean another 10-15% drop from current levels.
For buyers to regain control of the narrative, Bitcoin needs to reclaim that lost trendline and push back above both the 20-day and 50-day moving averages, currently hovering near $97,000-$104,000. That's a tall order given current momentum. Until that happens, every bounce risks forming another lower high in an established downtrend.
In other words, this isn't just a dip to buy reflexively. The technical structure has deteriorated enough that caution makes sense, even if you're a long-term believer. Sometimes the smart move is waiting for the dust to settle rather than trying to catch a falling knife—especially when that knife has already carved through a billion dollars in forced liquidations.
More News
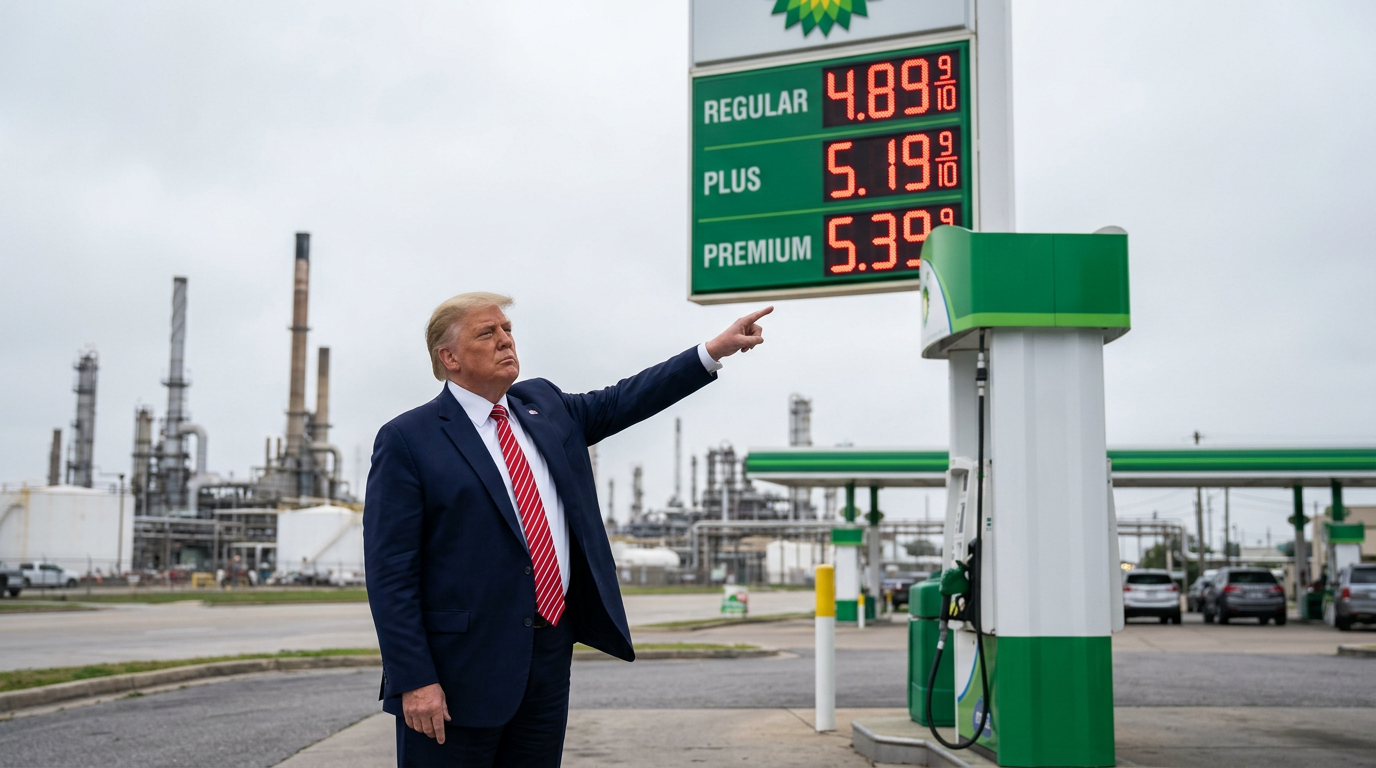
Trump Orders DOJ Probe Into Big Oil, Says Americans Are Being 'Gouged' At The Pump: 'Gasoline Prices Better Start...'
Get a Stake in OpenAI and Anthropic — Today

Futures Mixed as Trump Targets Gas Prices, FedEx Drops, and Micron Earnings Loom

Commerce Secretary Lutnick Warns of Chinese Robot Threat, Signals Crackdown on 'The Arms Race That Is Coming'

Tesla's Model Y and Model 3 Are the Most American-Made Cars Again — Here's Why That Matters Now

Trump's Secret Retirement Fund
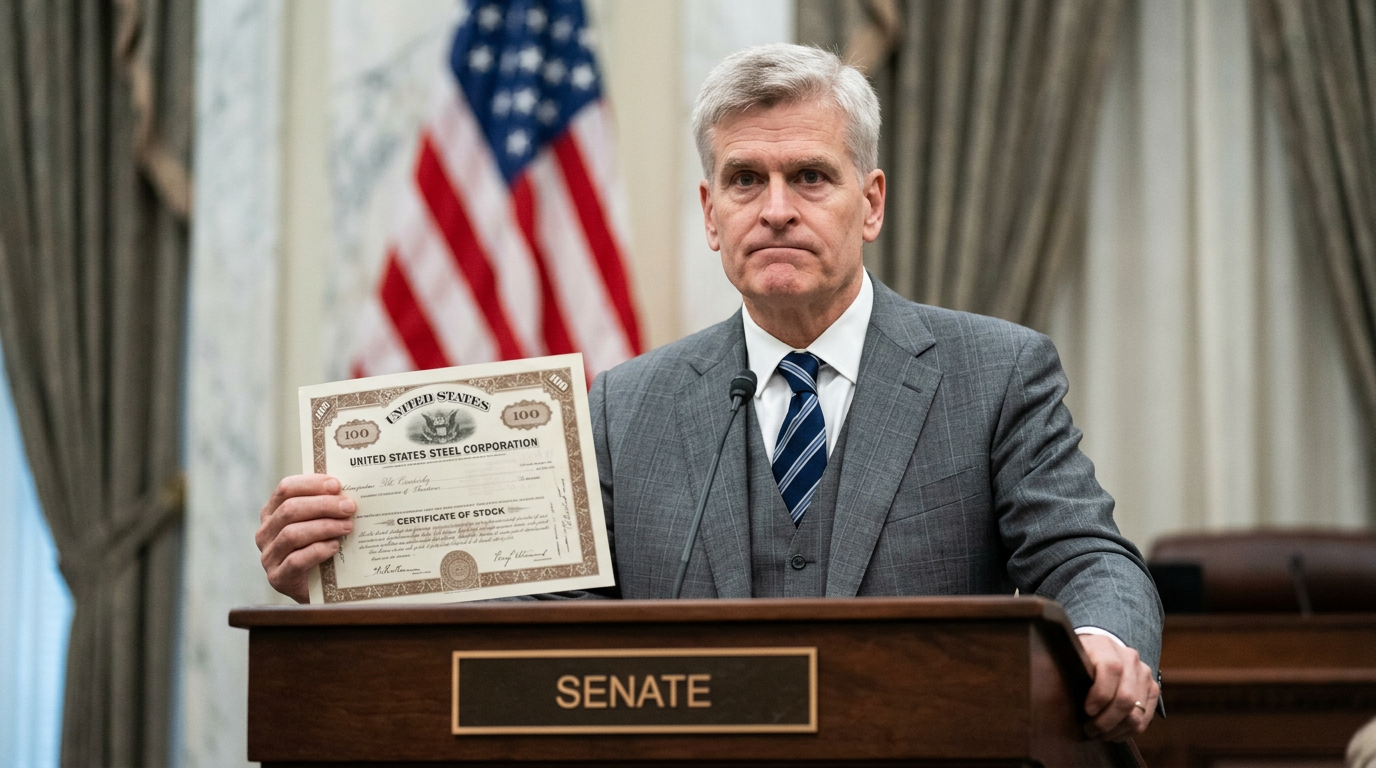
Bill Cassidy's $1.5 Trillion Social Security Hail Mary: Invest in Stocks, Avoid the Pain

The U.S. Government Is Betting $17.5 Billion That Nuclear Can Save the Grid
Get Market News Alerts
Real-time alerts on price moves, news, and trading opportunities.
Join 20,000+ investors. No spam, ever.
Featured Articles
View all newsTrump Orders DOJ Probe Into Big Oil, Says Americans Are Being 'Gouged' At The Pump: 'Gasoline Prices Better Start...'
By MarketDash
June 24, 2026

Trump and Elon Are Back (Ad)
By Stansberry Research
Futures Mixed as Trump Targets Gas Prices, FedEx Drops, and Micron Earnings Loom
By MarketDash
June 24, 2026
Commerce Secretary Lutnick Warns of Chinese Robot Threat, Signals Crackdown on 'The Arms Race That Is Coming'
By MarketDash
June 24, 2026
Tesla's Model Y and Model 3 Are the Most American-Made Cars Again — Here's Why That Matters Now
By MarketDash
June 24, 2026

Elon “xPhone” Exposed (Ad)
By Timothy Sykes
Bill Cassidy's $1.5 Trillion Social Security Hail Mary: Invest in Stocks, Avoid the Pain
By MarketDash
June 24, 2026
The U.S. Government Is Betting $17.5 Billion That Nuclear Can Save the Grid
By MarketDash
June 24, 2026