






Why a Company Can Grow Sales and Still Lose Your Money
MarketDash Editorial Team
Author
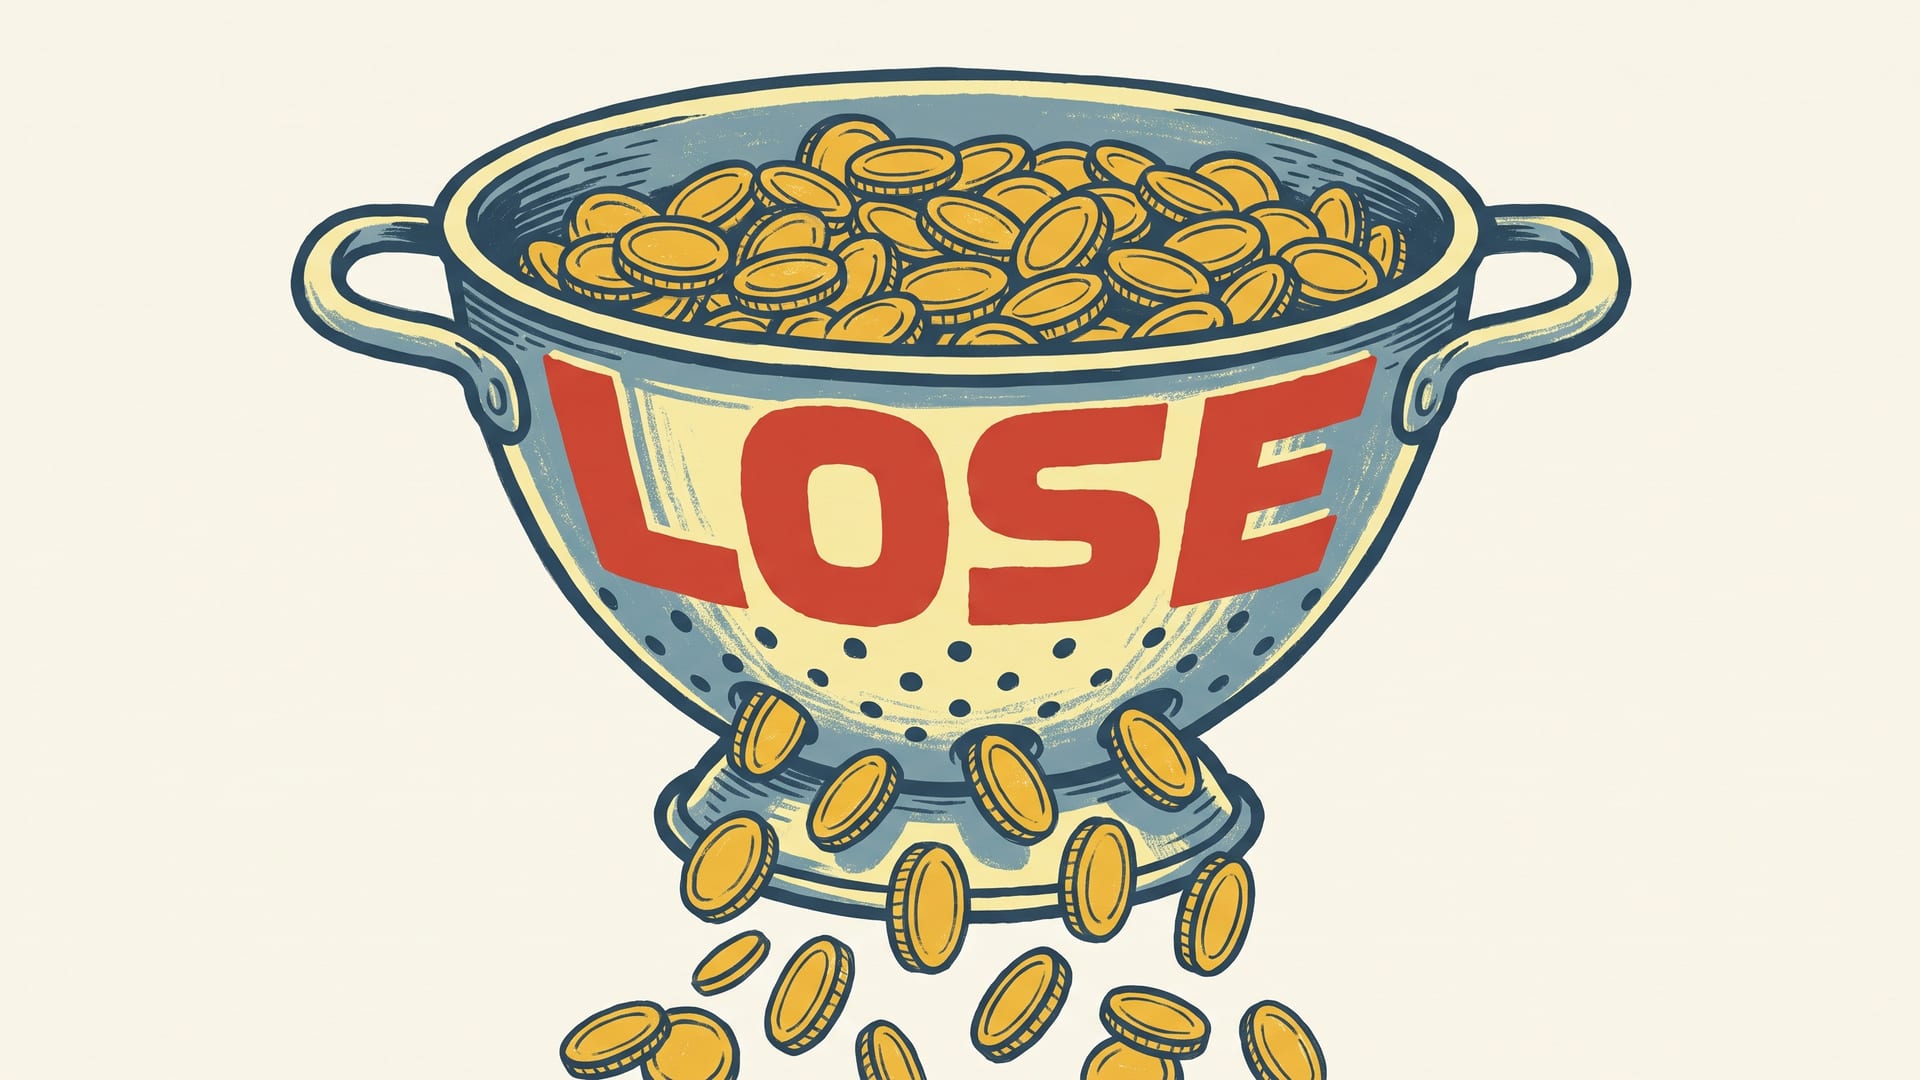
The Number in the Headline Is Not the Point
Here is a habit worth stealing: when a company reports results, skip the revenue line and go find the profit. Revenue is simply the money that came in the door. Profit is what's left after you pay everyone who helped make and sell the thing. One measures demand. The other measures whether the business actually works. Those are different questions, and only one of them can end up in your pocket.
A company can be world-class at finding customers and terrible at making money from them. Growth covers it up for a while, the way a loud party covers up a crack in the wall. Then growth slows, and the crack is the only thing left in the room.
So the useful skill isn't spotting growth. It's telling apart growth that produces profit from growth that just produces activity.
Gross Margin Is the First Honest Test
Gross margin is the share of each sale left over after the direct cost of the product. For a coffee shop, that's the beans, the milk, the cup, and the person pouring. It does not include rent, marketing, or the salary of the executive who explains the strategy on the call. It is the closest thing to a clean answer to one question: does this product make money at all?
You don't need a spreadsheet. You need the direction. Is gross margin steady, rising, or sliding as the company gets bigger? Rising gross margin means the company gets more efficient or has pricing power, which is a fancy way of saying customers would complain but they'd still pay. Sliding gross margin means each new sale brings less than the last one, usually because the company is discounting to win business or spending more per unit to deliver it.
That can work for a while. It cannot work forever, because "for a while" is a schedule, not a strategy.
Watch the Gap, Not Just the Line
Now compare the two growth rates: revenue and net income, which is the official profit at the bottom of the income statement, after interest and taxes. Look at several years, not one. If sales keep climbing while profit stays flat or falls, one of two things is usually true. Costs are eating the growth, or the company is buying customers and calling it demand.
Neither is automatically a scandal. A young company spending heavily to build something real can honestly show that pattern. But management should be able to tell you which one it is, and roughly when the spending stops. If the answer is a diagram and a vibe, that's information too.
Two places the gap likes to hide. First, "adjusted" profit, which adds back costs the company would prefer you ignore. Some add-backs are fair. Some are a genre of fiction. A cost that appears every single year has a strange definition of "one-time." Second, dividends. Dividend yield is a year of dividends per share divided by the share price. It's a nice number until you ask where the cash comes from. Dividends are paid in cash, and a company that isn't earning cash has to find it somewhere else, which means the payout is partly a promise about the future.
If You Can't Explain the Dime, You Own a Story
The test is simple enough to do on a napkin: can you explain, in one sentence, how a dollar of sales becomes a dime of profit? Who pays, what it costs to deliver, and what's left over. If the sentence needs a slide, a footnote, and a chart with a hockey stick in it, you don't own a thesis. You own a story with a ticker.
Stories aren't evil. They're just not auditable. The person telling the story is often paid in the stock, which is a conflict of interest wearing a nice jacket.
One more check that costs nothing: the P/E ratio, which is the share price divided by a year of profit per share. Notice what sits underneath the fraction. Profit. When profit is thin, the P/E is enormous or meaningless, and a company with no profit has no P/E at all. That's often why certain presentations never seem to include one.
Check it yourself in MarketDash
Open the stock page and go to the Intrinsic Value section. The discounted cash flow estimate there is built from future cash flows, which come from profit, not from sales. Ask what has to be true for that estimate to hold. If it only works when margins improve, then the estimate is a bet on the story, and now you know it.
Then open the Screener and look at the PE Ratio column next to Intrinsic Value %. A low price compared with the estimate is not a green light on its own. Pair it with the question you can now answer: is this company turning sales into profit, or just into activity? Revenue is the applause. Profit is the money in the till. Only one of them pays for the building.
Get Market News Alerts
Real-time alerts on price moves, news, and trading opportunities.
Join 20,000+ investors. No spam, ever.
Featured Articles
View all news
Bitcoin's Final Capitulation? Cowen Warns $40K Could Be Next

Meta Slapped With $887 Million Italian Fine Over Sneaky Photo Access

Oil Market Flips To Surplus As Gulf Supply Roars Back, IEA Says

Bernie Sanders Says Starter Homes Now Cost $1 Million In 242 Cities As First-Time Buyer Age Hits 40

Sean Duffy to Congress: Fund Trump's Air Traffic Control Overhaul or Risk Safety

Mike Johnson Says FAA Doesn't Need a Probe, It Needs a Checkbook as Duffy's $50 Billion Ask Draws Fire

Musk's SpaceX Hit With Fresh Zelenskyy Backlash Over 161 Kph Starshield Speed Cap